Candlestick Patterns: How to Read Price Action
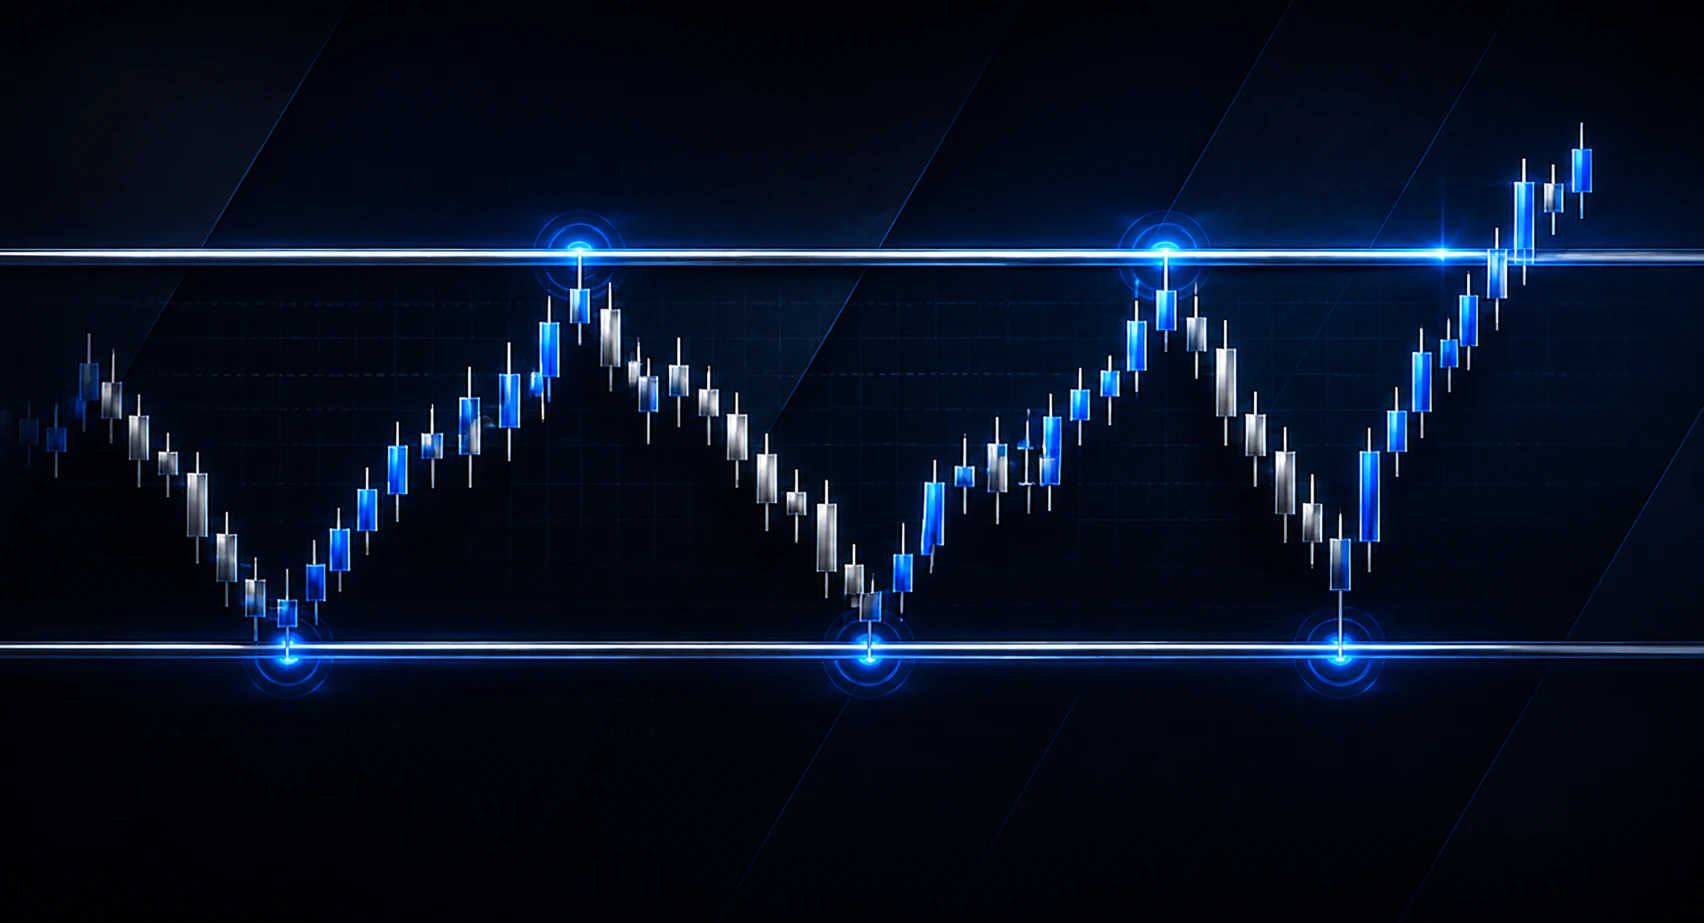
Candlestick charts turn price movement into a sequence of visual bars. Each candle records what happened during a selected period, while recurring combinations of bodies and wicks help traders compare buying pressure, selling pressure, momentum and rejection.
Named patterns such as the doji, hammer and engulfing candle make these observations easier to describe. Their value comes from combining the candle shape with trend, market structure and nearby price levels. This article builds on the principles explained in What Is Price Action Trading?.
How a Candlestick Works
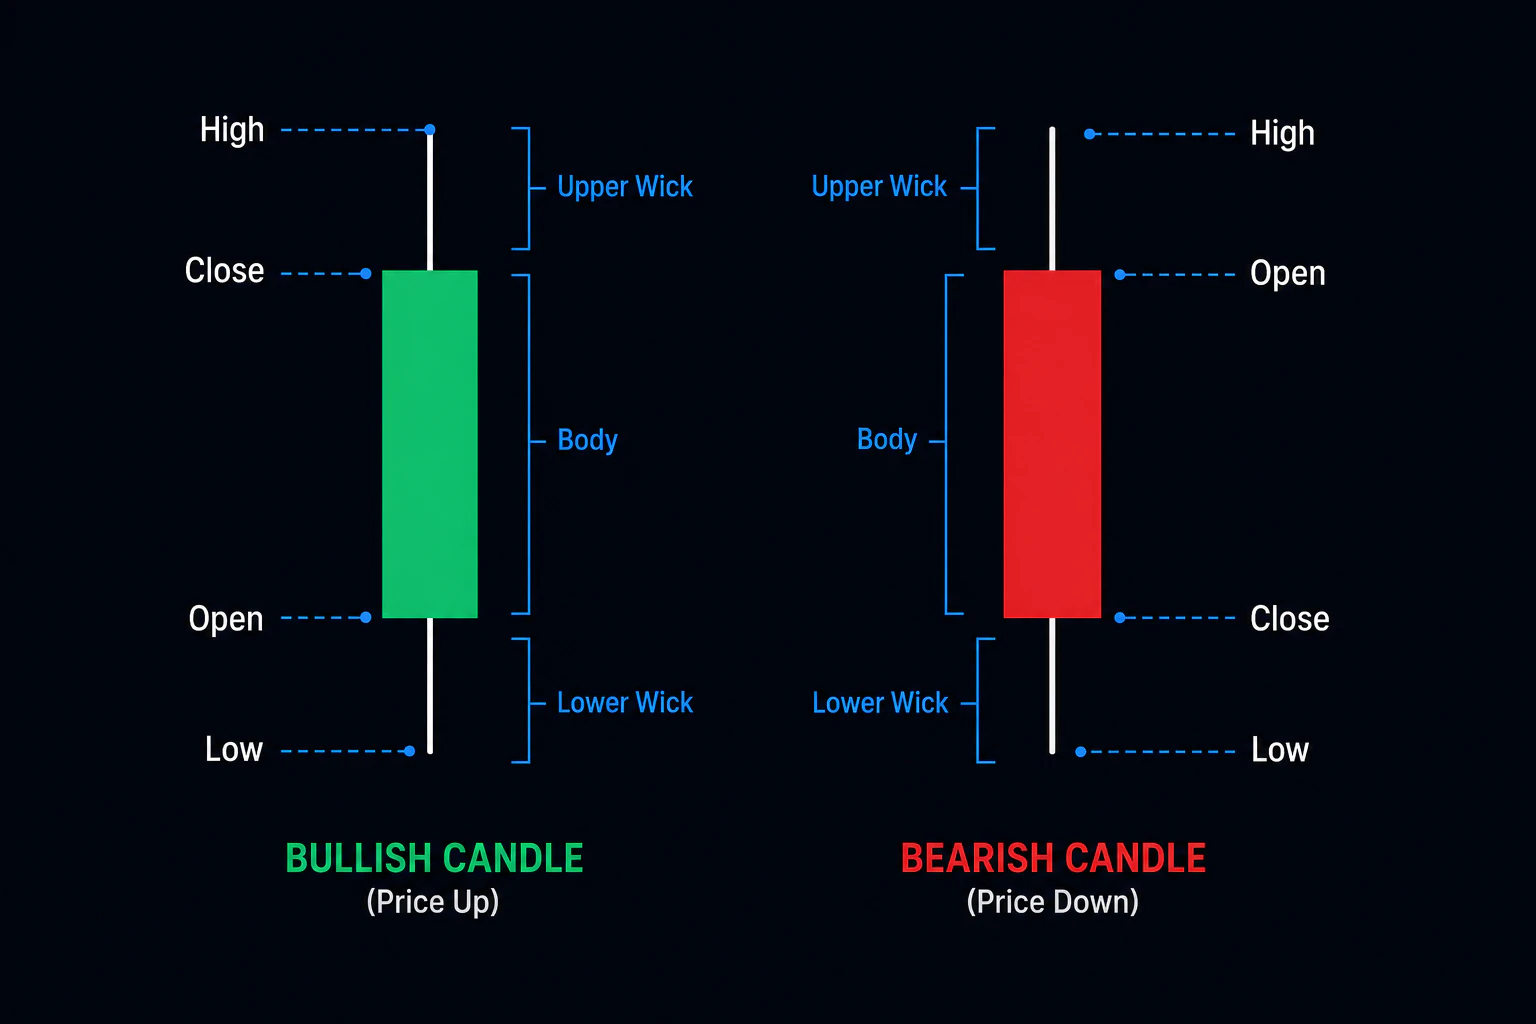
Every candlestick is built from four prices, often abbreviated as OHLC:
- Open — the price at the beginning of the period;
- High — the highest price reached during the period;
- Low — the lowest price reached during the period;
- Close — the price at the end of the period.
The body is the area between the open and close. The thin lines above and below it are called wicks or shadows and show the high and low. A candle that closes above its opening price is bullish, while a candle that closes below its opening price is bearish. Chart colours vary by platform, so direction should always be checked against the open and close rather than colour alone.
What Candle Shape Can Reveal
The relationship between the body, wicks and total range shows how price moved before the candle closed:
- A long body shows a decisive move from the open to the close;
- A small body shows that the open and close remained close together;
- A long lower wick shows that price moved down and then recovered;
- A long upper wick shows that price moved up and then retreated;
- A wide range indicates stronger movement during the period than a narrow range.
These features describe the behaviour inside the candle. The next step is to compare that behaviour with the candles around it and the area of the chart where it formed.
Single-Candle Patterns
Doji
A doji forms when the open and close are equal or very close, leaving little or no visible body. It shows that neither side maintained control into the close. A doji becomes more useful when it appears after a sustained move, near a recognised level or alongside other evidence that momentum is changing.
Hammer and Shooting Star
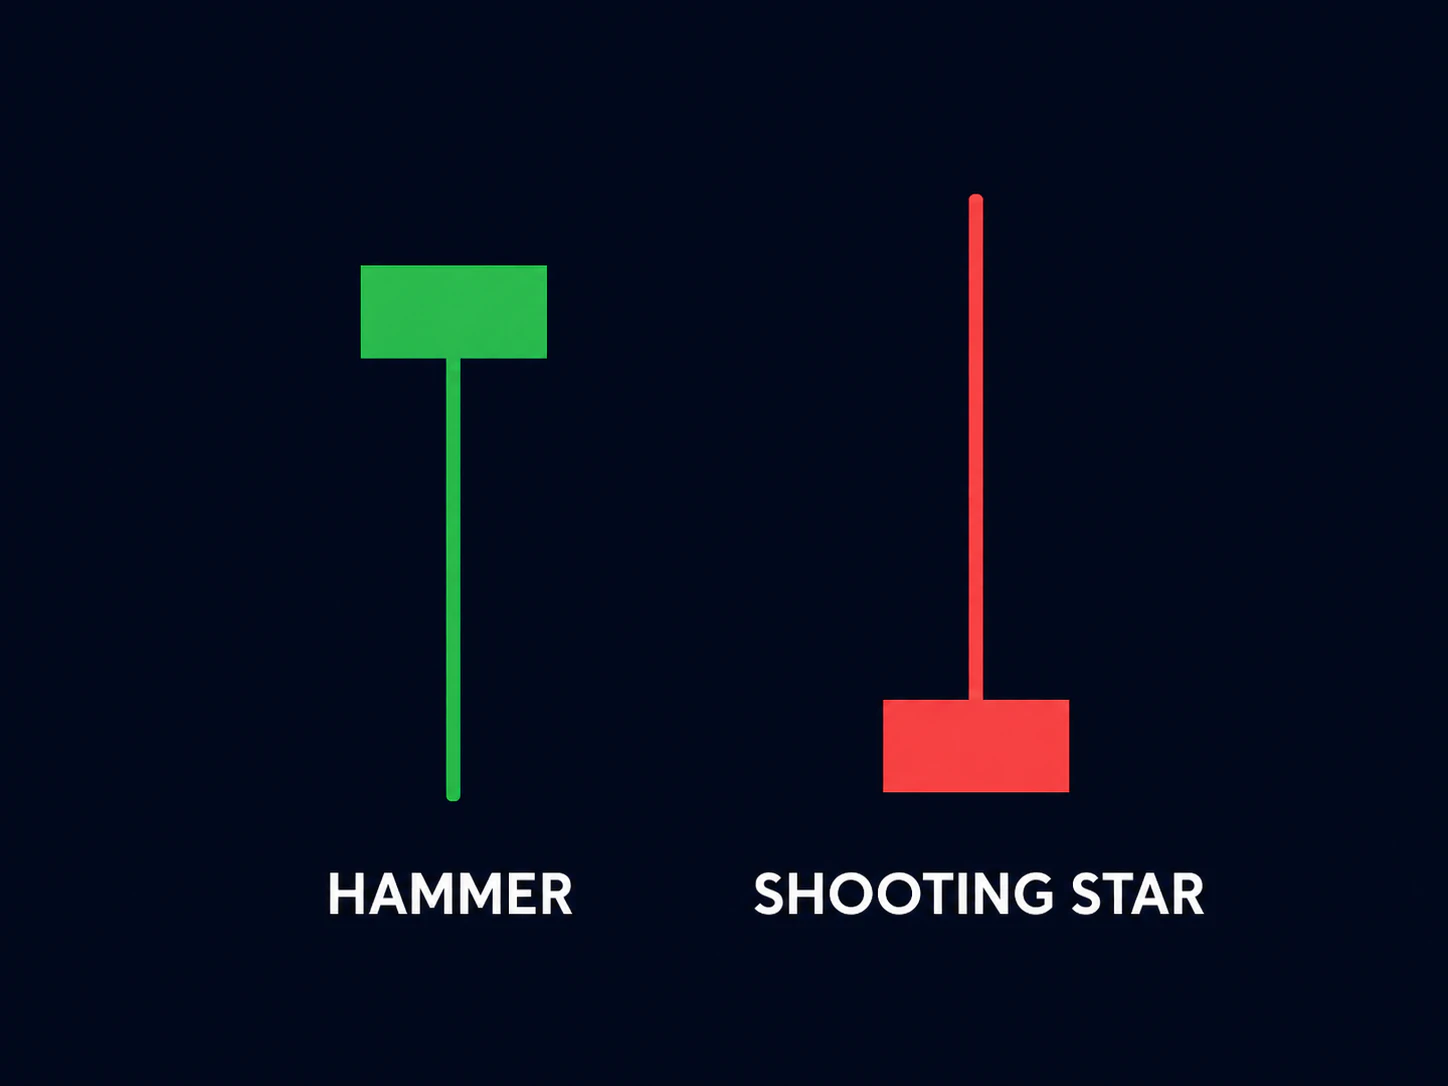
A hammer has a small body near the top of its range and a long lower wick. It usually attracts attention after a decline because the candle shows that lower prices were rejected before the close. When the same general shape forms after an advance with a long upper wick and a body near the low, it is called a shooting star and highlights rejection of higher prices.
The position of the candle matters as much as its shape: a hammer near support has a different context from a hammer in the middle of a directionless range, just as a shooting star near resistance is more relevant than one appearing without a nearby level.
Two-Candle Patterns
Bullish and Bearish Engulfing
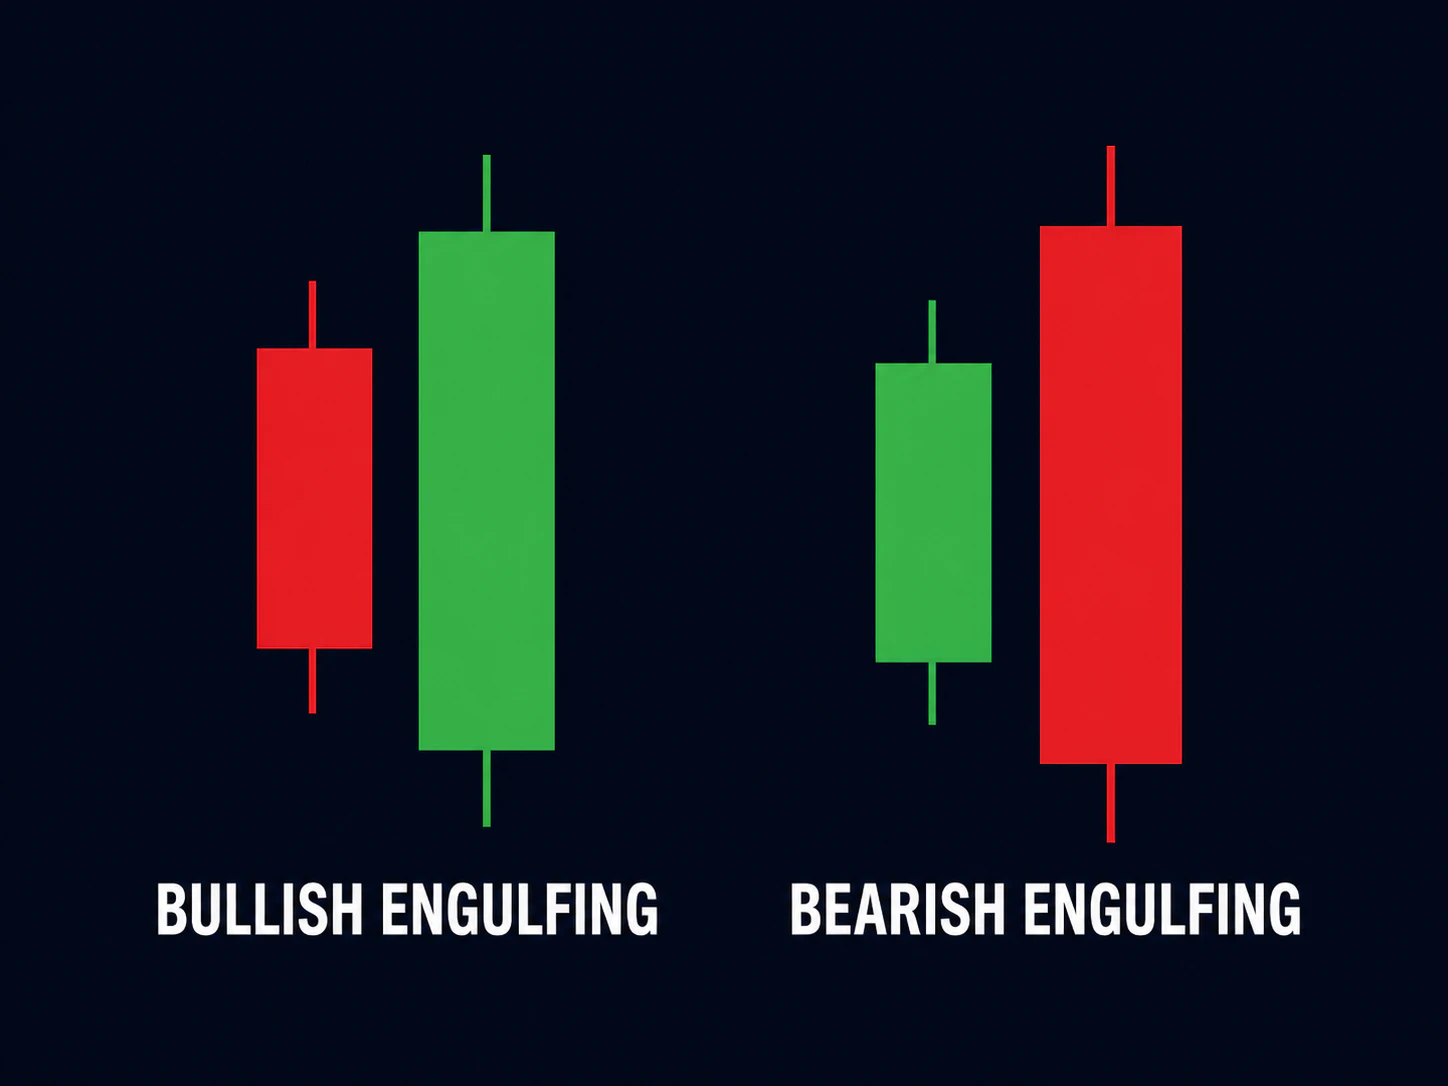
A bullish engulfing pattern consists of a bearish candle followed by a bullish candle whose body covers the previous candle's body. The second close shows that buyers have recovered the prior period's decline and finished in control. A bearish engulfing pattern reverses the sequence: a bullish candle is followed by a larger bearish body that covers it, showing a shift toward selling pressure.
Engulfing patterns are commonly evaluated after an extended move or at a clear support or resistance zone. The candle bodies are the defining feature; the wicks do not need to be completely engulfed.
Inside Bar
An inside bar forms when the full high-to-low range of a candle sits within the range of the previous candle, often called the mother bar. It represents contraction or a pause after the earlier movement. Traders then watch how price interacts with the mother bar's high and low to judge whether momentum resumes or the market begins to reverse.
Three-Candle Patterns
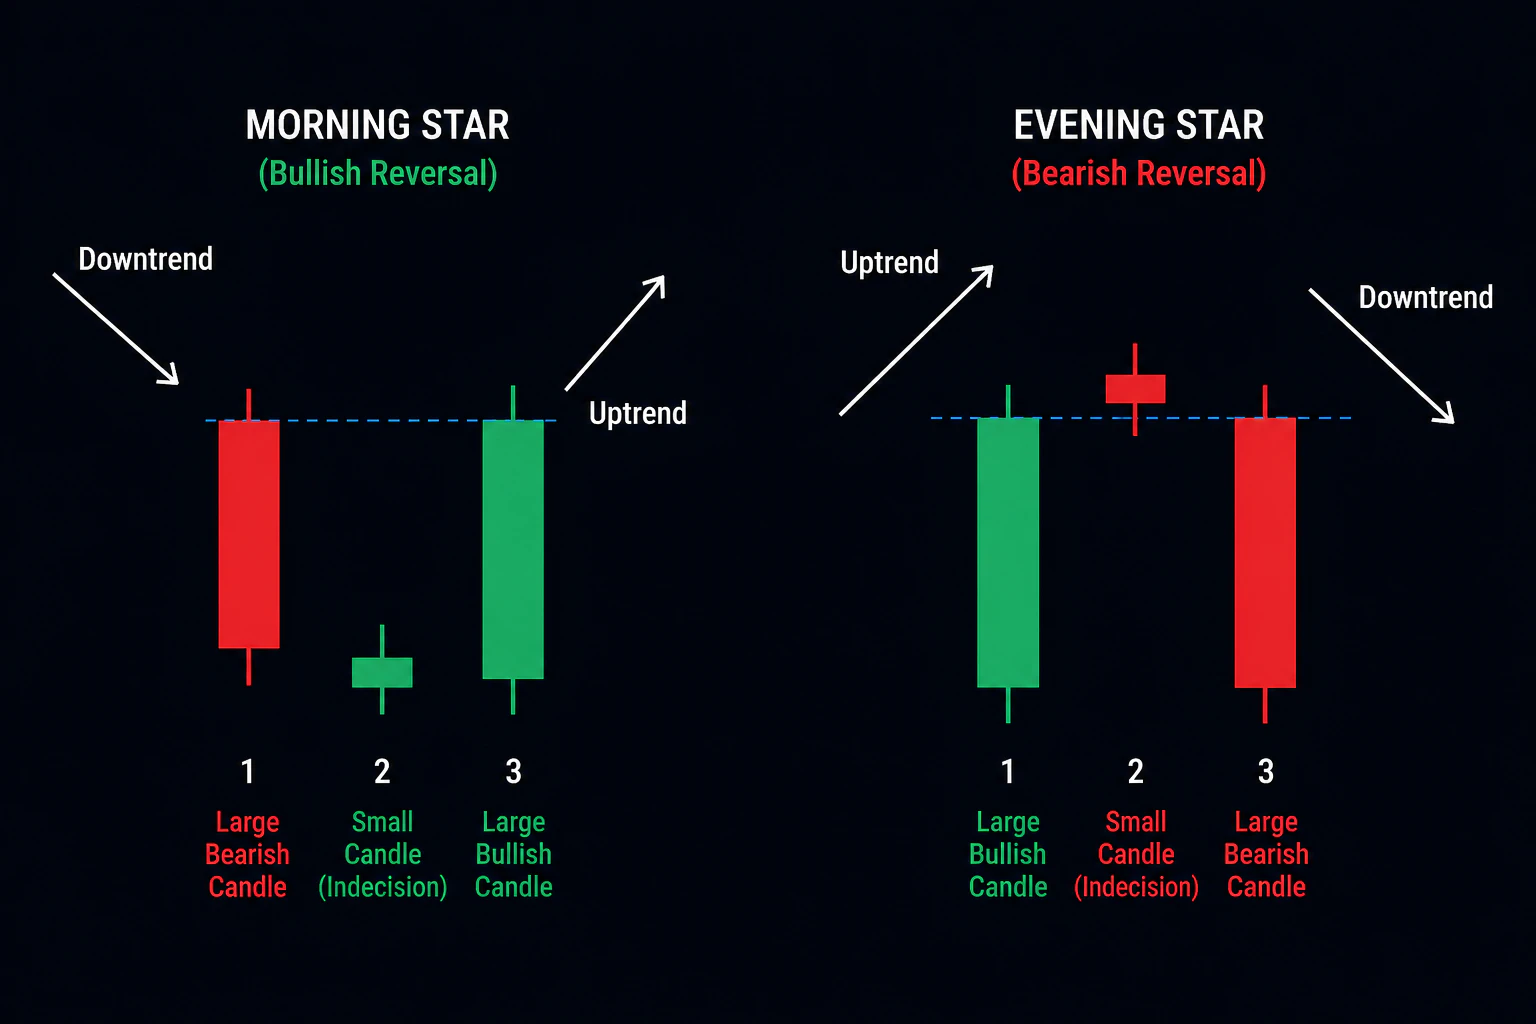
Morning Star
A morning star begins with a strong bearish candle, continues with a small-bodied candle showing reduced downward momentum, and finishes with a bullish candle that closes well into the first candle's body. It is typically studied after a decline as evidence that selling pressure has weakened and buyers have responded.
Evening Star
An evening star is the opposite sequence: a bullish candle, a small-bodied transition candle and a bearish candle that closes well into the first candle's body. It is usually examined after an advance as a sign that buying pressure has faded and sellers have taken control of the third period.
Gaps between the candles are common in textbook examples, especially in markets with defined trading sessions, but continuous markets may form the same shift in pressure without a clear gap.
How to Read Patterns in Context
A candlestick pattern becomes more informative when it answers a wider market question. Before using a pattern, review four factors:
- Location — is the pattern forming near a level that has already influenced price?
- Trend — does it support the prevailing direction or suggest that an extended move is losing momentum?
- Timeframe — does the pattern fit the timeframe used for the trading decision?
- Confirmation — has the candle closed, and what does the next price movement show?
Location is especially important. A bullish engulfing pattern at an established support zone provides clearer context than the same two candles in the middle of an irregular range. The guide to Support and Resistance in Trading explains how these zones are identified and monitored.
Wait for the selected candle to close before naming the pattern. A developing candle can resemble a hammer, doji or engulfing formation and change completely before the period ends. Some traders also use the following candle, a break of the pattern range or another technical condition as confirmation.
A Practical Candlestick Checklist
- Identify the current trend or trading range.
- Mark the nearest support, resistance or previous swing level.
- Describe the candle structure: body size, wick length and total range.
- Name the pattern only after the candle has closed.
- Define the confirmation condition, invalidation level and maximum risk before entering a trade.
Common Mistakes
- Trading a pattern solely because its shape matches a textbook example;
- Ignoring the preceding trend and the pattern's location on the chart;
- Acting before the candle has closed;
- Confusing candle colour settings with bullish or bearish direction;
- Searching for a pattern that supports a decision already made;
- Entering without a predefined invalidation level or risk limit.
Limitations
Candlestick patterns summarise past price behaviour; they do not determine the next market move. Different traders may define the same formation slightly differently, and market conditions can change quickly. Patterns are therefore most useful as one part of a broader process that includes market structure, confirmation and risk management.
Summary
Candlestick patterns organise the open, high, low and close into recognisable descriptions of momentum, rejection, contraction and changing pressure. Doji, hammer, shooting star, engulfing, inside bar, morning star and evening star patterns each highlight a different interaction between buyers and sellers.
The strongest reading comes from combining the pattern with its location, the prevailing trend, the selected timeframe and a clear confirmation rule. This turns candlestick analysis from simple shape recognition into a structured method for reading price action.
Want to practise reading candlestick patterns without risking real funds? Open a free Atlant Trade demo account.