Support and Resistance in Trading
Support and resistance are among the most widely used concepts in technical analysis. They describe price areas where buying or selling interest has previously been strong enough to slow down or reverse a move. Understanding how these levels form — and how unreliable they can be — is a foundational part of reading a price chart.
This article is part of a broader look at price action trading, which covers how traders read raw price movement more generally.
What Is Support?
Support is a price area where a decline has previously slowed or reversed, suggesting that buying interest was strong enough at that point to absorb selling pressure. When price approaches a support area from above, some traders watch for signs that buyers may step in again.
What Is Resistance?
Resistance is the opposite: a price area where an advance has previously slowed or reversed, suggesting that selling interest was strong enough to overcome buying pressure. When price approaches resistance from below, some traders watch for signs that sellers may step in again.
Why These Levels Develop
Support and resistance levels are thought to develop because market participants remember prior price reactions and place orders around similar levels again — for example, a trader who missed a bounce off a certain price may place a buy order near that level the next time price approaches it. This is a behavioral explanation rather than a guaranteed mechanism, and it does not mean a level will always produce the same reaction twice.
Zones, Not Exact Prices
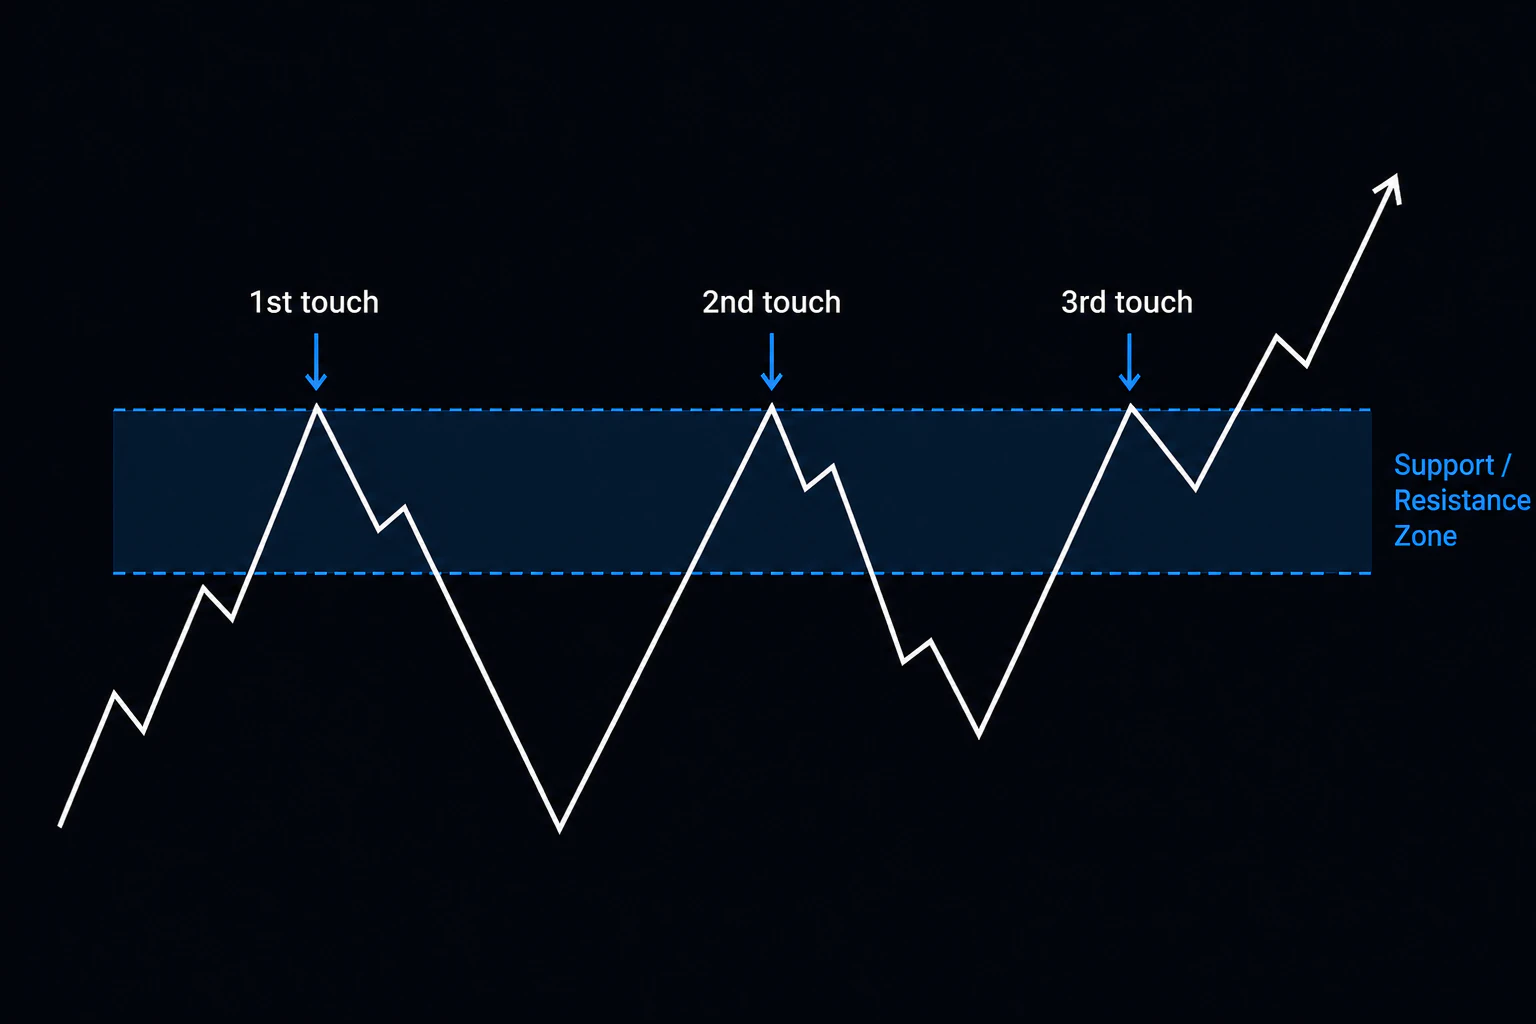
Because reactions rarely occur at one precise price twice, support and resistance are usually best treated as zones — a range of prices — rather than an exact line. Treating a level as a single precise number can lead to reading a slightly different reaction as a failure of the level, when it may simply have reacted a small distance away.
Previous Highs and Lows
The simplest way to identify a potential level is to look at previous swing highs and swing lows on the chart. A prior swing low that price approaches again from above may act as support. A prior swing high that price approaches again from below may act as resistance.
Repeated Tests
A level that has been tested — meaning price has approached and reacted to it — more than once is sometimes considered more notable than a level that has only been touched once, simply because there is more historical evidence of a reaction there. This does not mean a level becomes stronger indefinitely with each test; some traders argue that a level tested too many times may eventually be more likely to break, since each test can absorb some of the orders resting at that price.
Role Reversal: Support Becoming Resistance
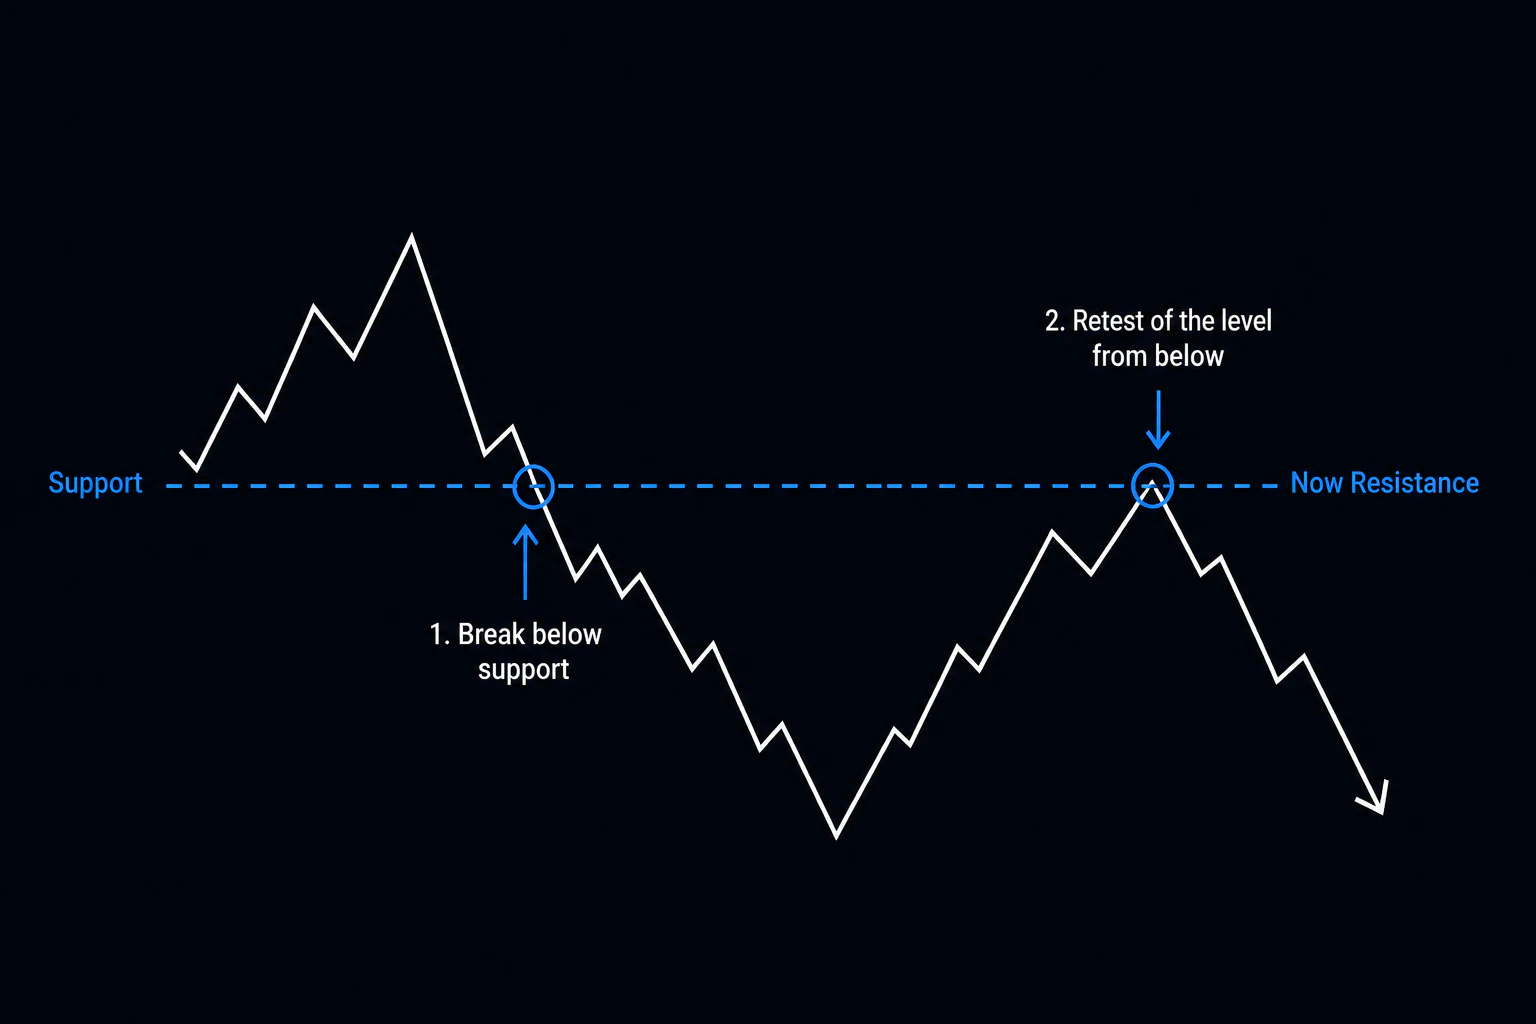
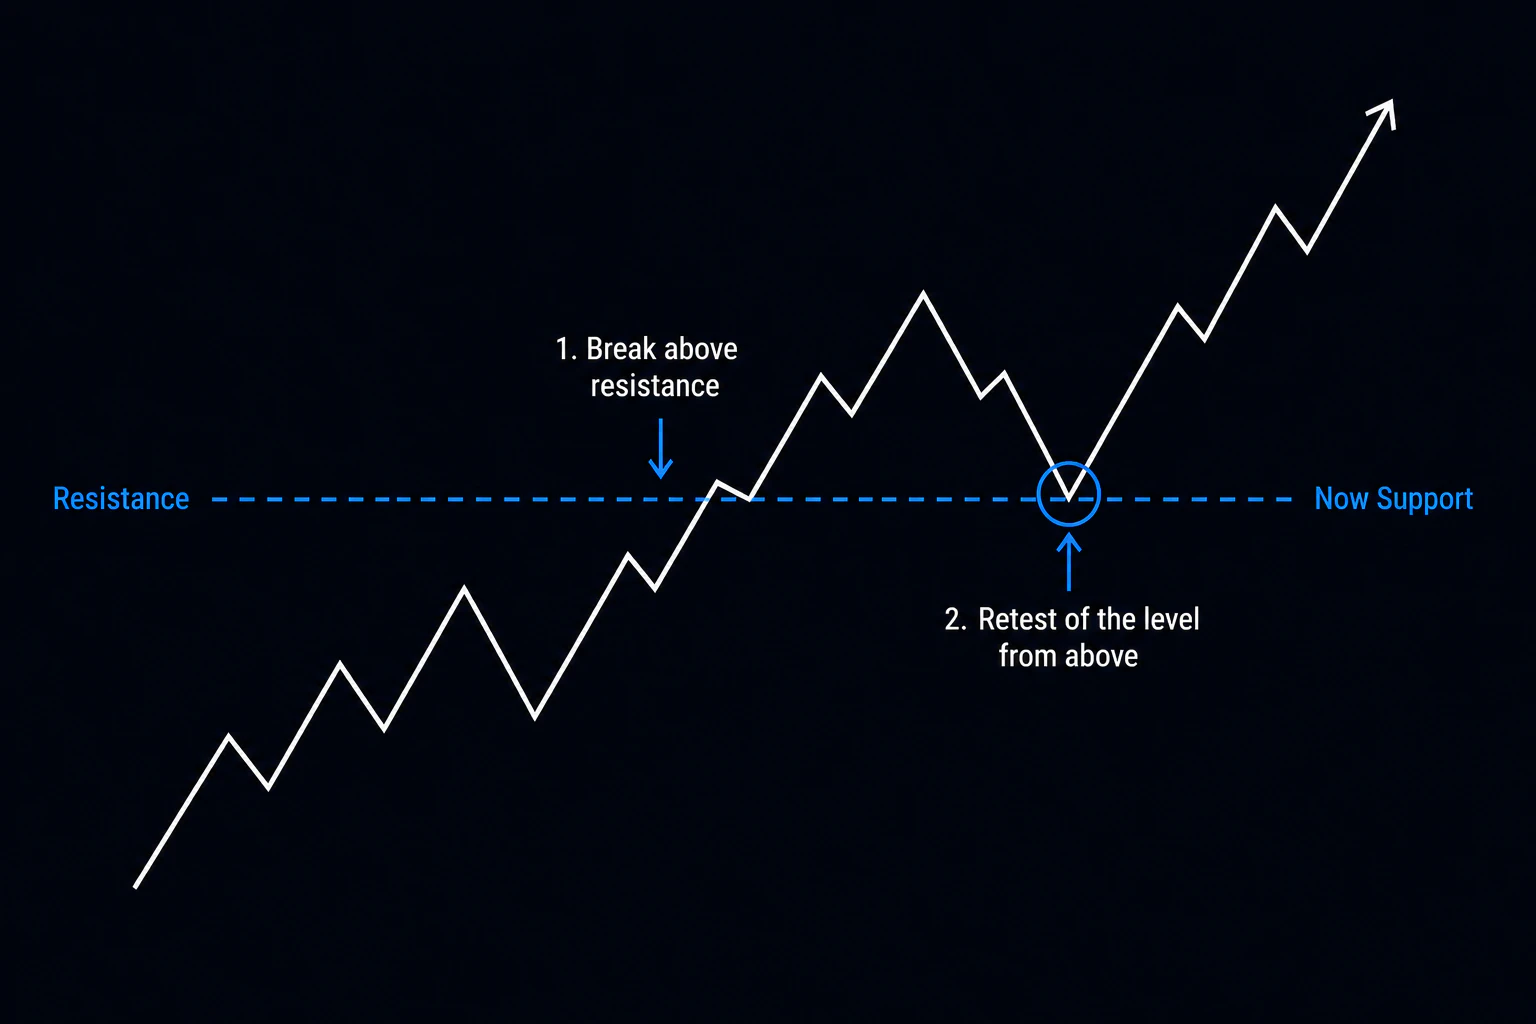
When price breaks below a support level, that same level can sometimes act as resistance if price later returns to it from below. The reasoning given for this is that former buyers who are now at a loss may sell to exit near their entry price, and traders who missed the initial breakdown may sell there as a new opportunity. The reverse is also commonly described: a broken resistance level potentially acting as support if price returns to it from above.
This role-reversal idea is a common heuristic, but it does not happen every time a level is broken and retested — many breakouts continue without any meaningful reaction at the former level.
Breakouts
A breakout occurs when price moves through a support or resistance zone and continues beyond it. Breakouts are often associated with increased participation or a shift in the balance between buyers and sellers, though this isn't always visible in real time.
Failed Breakouts
A failed breakout occurs when price moves beyond a level but then reverses back inside the prior range shortly afterward. Failed breakouts are common, which is why relying on the first touch of a broken level as automatic confirmation can lead to entering just before a reversal.
Candlestick shapes at the point of a breakout or rejection can add further context — see candlestick patterns: how to read price action.
The Retest
After a breakout, price sometimes returns to test the broken level before continuing in the breakout direction. Some traders wait for this retest as a way of gaining additional information, though a retest is not guaranteed to occur, and price can continue directly without ever returning to the level.
Horizontal Levels
Horizontal support and resistance — levels drawn at a fixed price regardless of time — are the most straightforward type, based directly on prior highs and lows.
Dynamic Support and Resistance
Not all support and resistance is horizontal. A rising or falling moving average can act as a dynamic reference level that shifts over time, with price sometimes reacting to it in a similar way to a horizontal zone. Trendlines — diagonal lines connecting a series of swing highs or swing lows — are used similarly, providing a sloped reference rather than a fixed price.
Moving averages and their common configurations are discussed in the Bollinger Bands and Stochastic beginner strategy, which uses a moving-average-based indicator as one of its core components.
Timeframe Differences
A level that is significant on a daily chart may be far less relevant on a one-minute chart, and vice versa. Generally, levels identified on higher timeframes are considered more significant, since they reflect a longer history of price reaction, but this is a matter of degree rather than an absolute rule.
Psychological Price Levels
Round numbers — such as a price ending in .00 or a whole number in an asset's price — are sometimes observed to act as informal support or resistance, on the theory that traders round decisions to convenient reference points. This effect, where it exists, tends to be modest and inconsistent, and should not be treated as a strong signal on its own.
Identifying Relevant Zones
When looking for potentially relevant levels, traders commonly consider:
- How many times price has previously reacted at or near the level
- How significant the resulting move was after each reaction
- Whether the level is visible on a higher timeframe
- Whether it aligns with a round number or a widely watched prior high or low
- How far price currently is from the level
A Simple Example
Suppose a market has twice failed to close above a particular price over the past month, each time pulling back afterward. A trader might mark this as a resistance zone. If price approaches this zone a third time, some traders would watch closely for another rejection, while others might view three approaches as increasing the chance that the level finally breaks. Neither view is definitively correct — this is precisely the kind of judgment call that makes support and resistance interpretive rather than mechanical.
Avoiding Mechanical Rules
It can be tempting to adopt fixed rules, such as treating three touches as automatic proof of a strong level. These kinds of rules are not reliable on their own. The number of touches is only one factor among several, and a level can fail on its first, second, or fifth test. Similarly, there is no rule guaranteeing that a level must hold — plenty of well-tested levels break without warning.
Common Mistakes
- Treating a level as an exact price rather than a zone
- Assuming a level must hold simply because it has held before
- Ignoring the broader trend when evaluating a level's likely significance
- Entering immediately on the first touch of a broken level without waiting for confirmation
- Drawing so many levels on a chart that nearly every move appears to react to one
False Signals and Limitations
False breakouts, failed retests, and levels that simply stop working after years of holding are all a normal part of using support and resistance. No method exists for knowing in advance which reaction a given level will produce. Support and resistance analysis provides context for a decision — it does not provide a guaranteed outcome.
Risk Considerations
Because a level can fail at any time, any decision based on a support or resistance zone should include a predefined point at which the idea is considered invalid, and a limit on how much is risked if that happens.
These principles are discussed further in improving trading performance with controlled risk.
Summary
Support and resistance describe price areas where buying or selling interest has previously been strong enough to slow or reverse a move. They are best treated as zones rather than exact prices, and no level is guaranteed to hold or break. Combined with an understanding of trend, timeframe, and risk management, support and resistance can add useful context to a trading decision, but they remain interpretive rather than mechanical.
Want to practice spotting these zones on a real chart risk-free? Open a free Atlant Trade demo account