How to Use RSI: Signals, Divergence and Common Mistakes
The Relative Strength Index (RSI) is a momentum oscillator that compares recent upward and downward closing-price changes. It can help describe momentum, but it does not predict the next candle or guarantee an Up or Down result.
This guide explains how RSI is calculated, how traders interpret its levels and divergences, and how to turn an observation into a rule that can be tested. Examples are educational only; the settings and conditions must be checked against the asset, chart period and transaction rules actually shown on the platform.
What RSI measures
RSI is bounded between 0 and 100. It rises when average recent gains become stronger relative to average recent losses and falls when losses dominate. Because it is calculated from price changes, RSI describes momentum in the selected data; it does not measure fundamental value, order flow, trading volume or the probability that a transaction will finish profitably.
A 14-period RSI is a common starting point. Here, “period” means 14 chart bars or candles—not necessarily 14 days. On a one-minute chart it uses one-minute bars; on a five-minute chart it uses five-minute bars. The same RSI setting can therefore tell a different story on different chart periods.
How RSI is calculated
The standard calculation separates positive and negative closing-price changes, smooths their averages and compares them as relative strength (RS). Wilder's smoothing is commonly used by charting platforms.
RSI = 100 − [100 ÷ (1 + RS)]
RS is the smoothed average gain divided by the smoothed average loss for the selected lookback. If there is no average loss in the sample, RSI is conventionally at or near 100; if there is no average gain, it is at or near 0. Small differences between platforms can occur because of data feeds, bar construction, rounding or smoothing implementation.
How to read 70, 50 and 30
| RSI area | Common interpretation | What it does not prove |
|---|---|---|
| Above 70 | Strong recent upward momentum; often labelled overbought | That price must fall next |
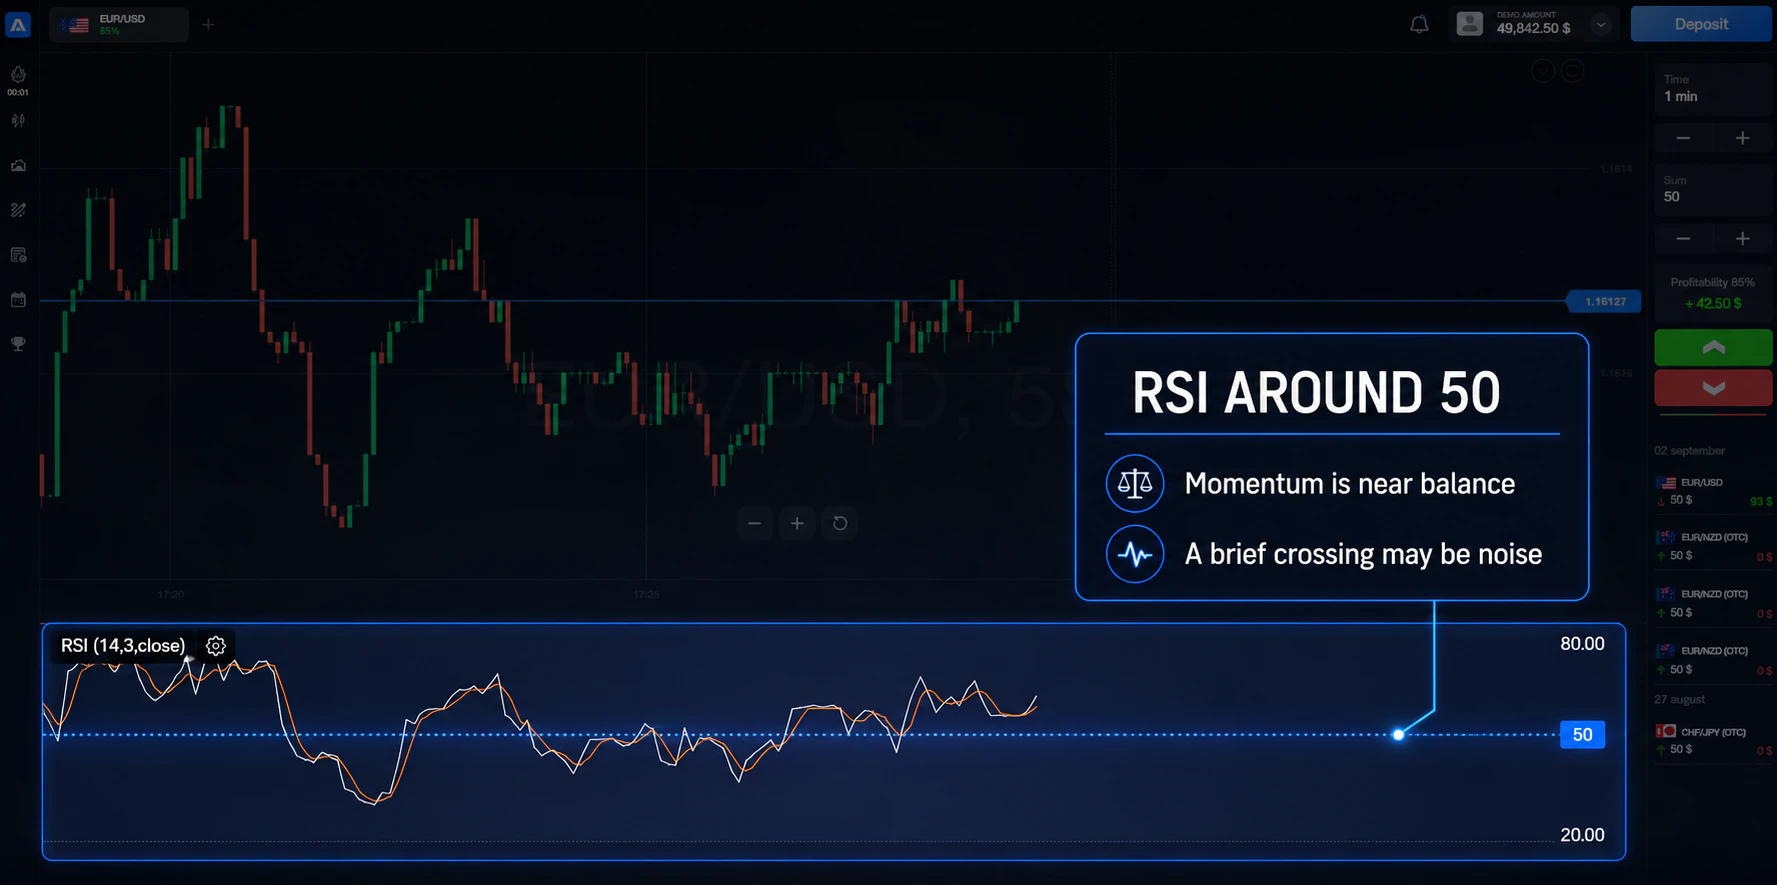
| Around 50 | Recent gains and losses are closer to balance | That the market has no trend |
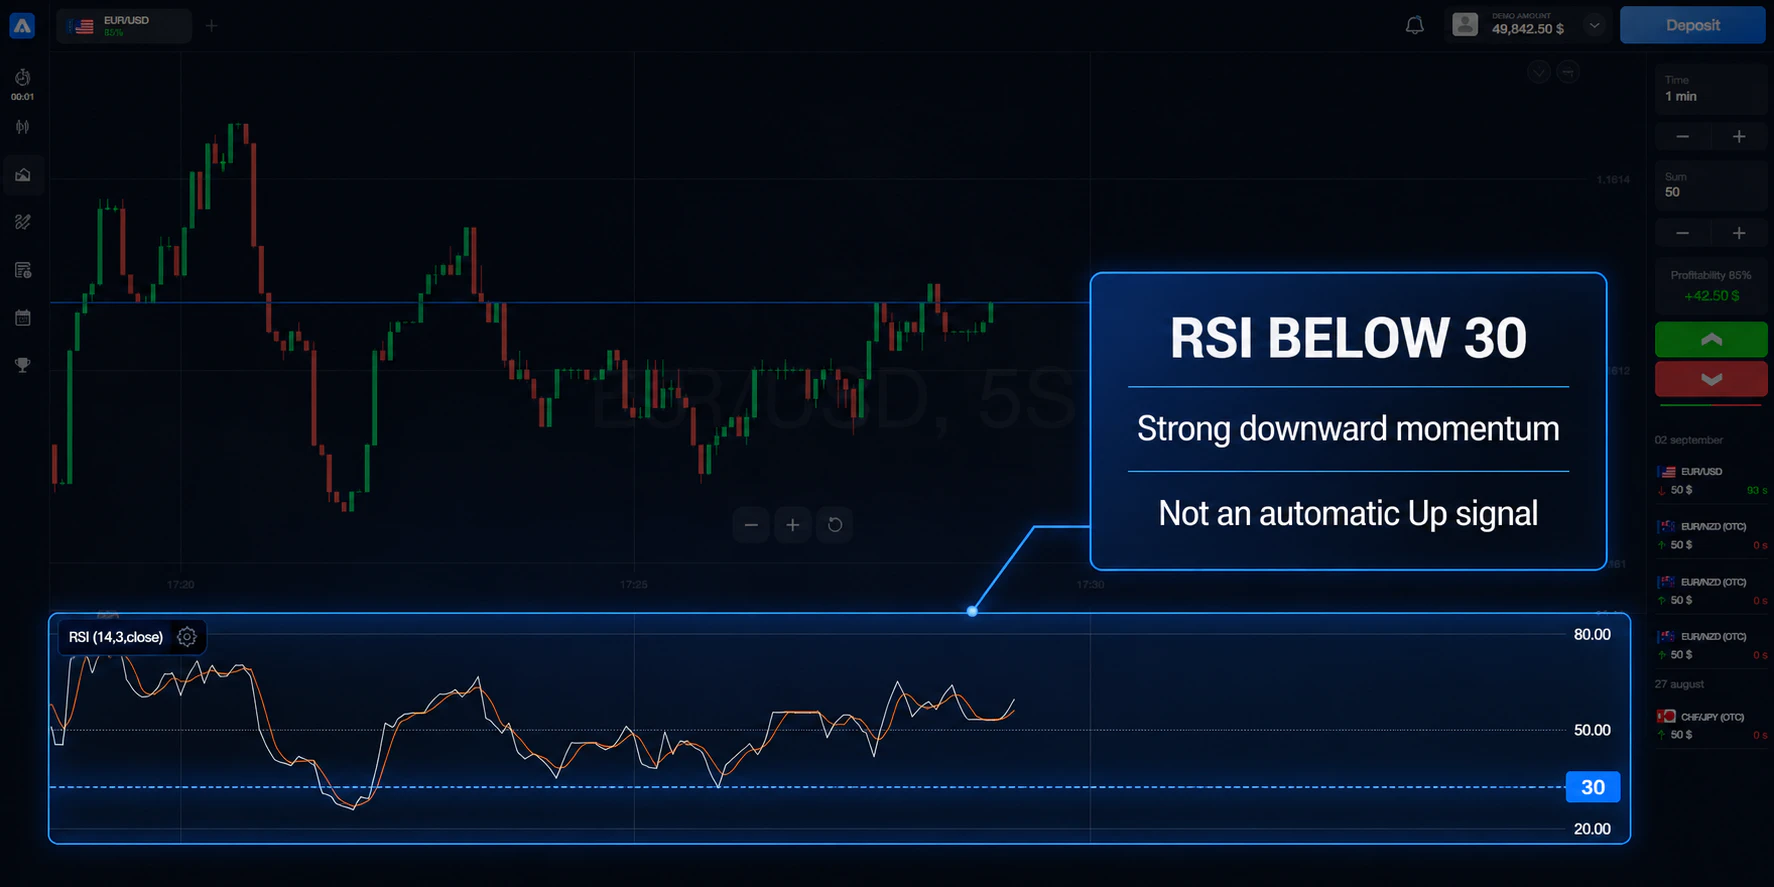
| Below 30 | Strong recent downward momentum; often labelled oversold | That price must rise next |
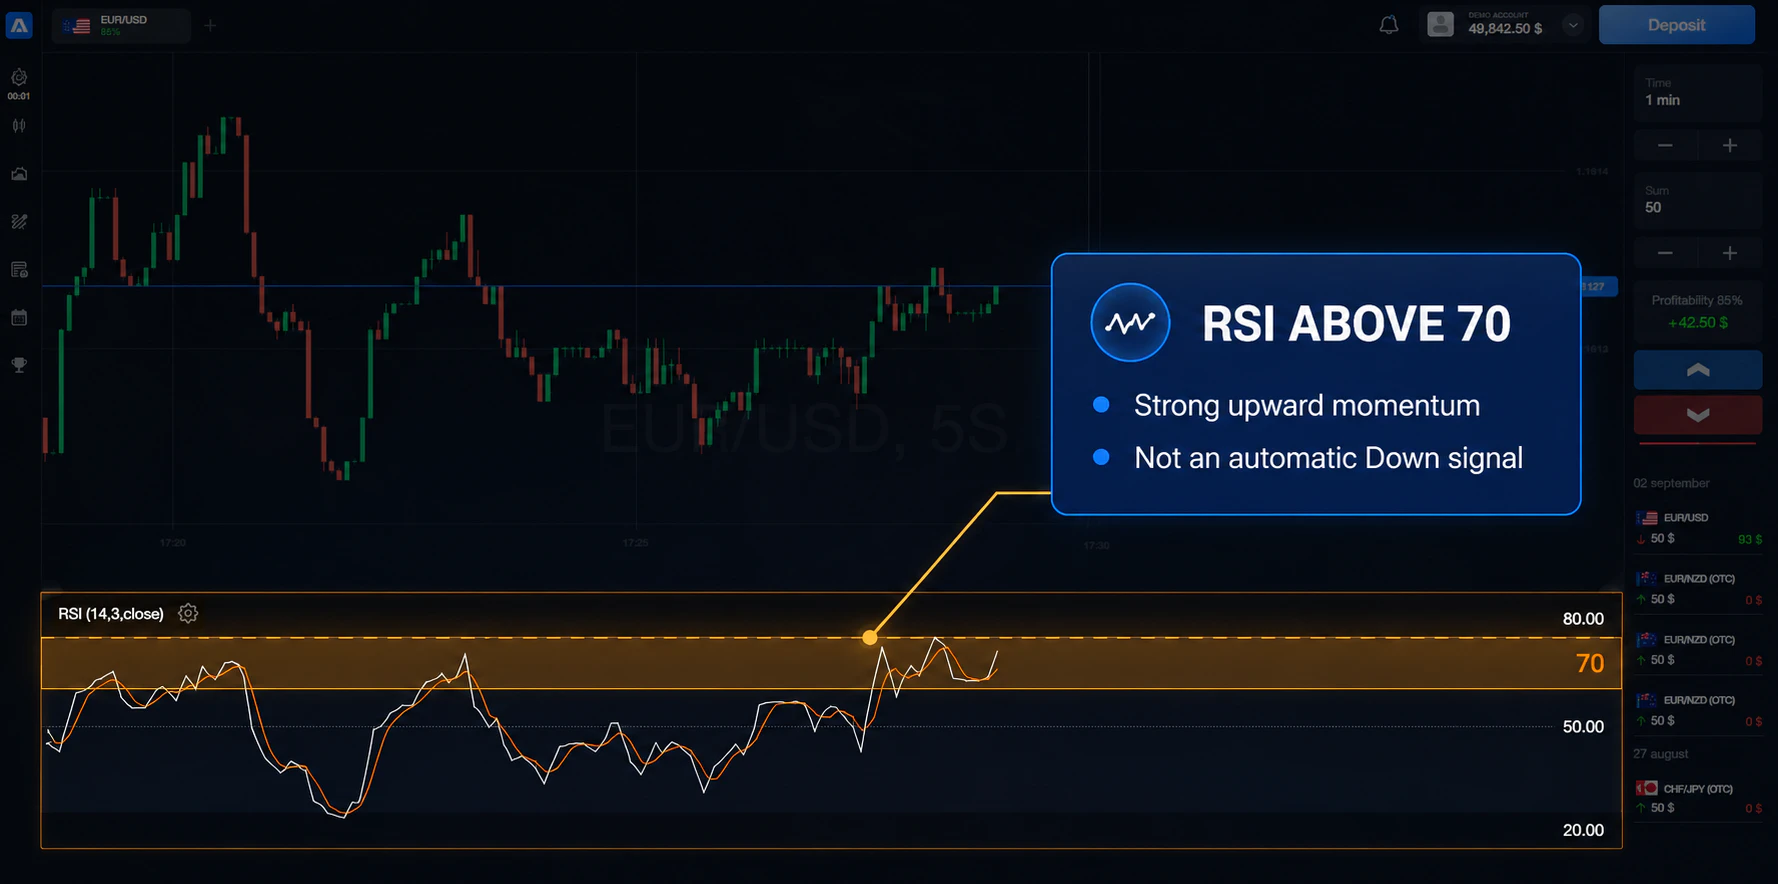
The 70 and 30 levels are reference zones, not automatic entry commands. In a strong trend, RSI can remain above 70 or below 30 for many candles. Opening a Down trade only because RSI exceeds 70—or an Up trade only because it falls below 30—can therefore place a position directly against persistent momentum.
The 50 line is also contextual. Sustained readings above 50 may support an upward momentum bias, while readings below 50 may support a downward bias. A brief crossing can be noise, so compare it with price structure and recent RSI behaviour.
Add RSI to a chart
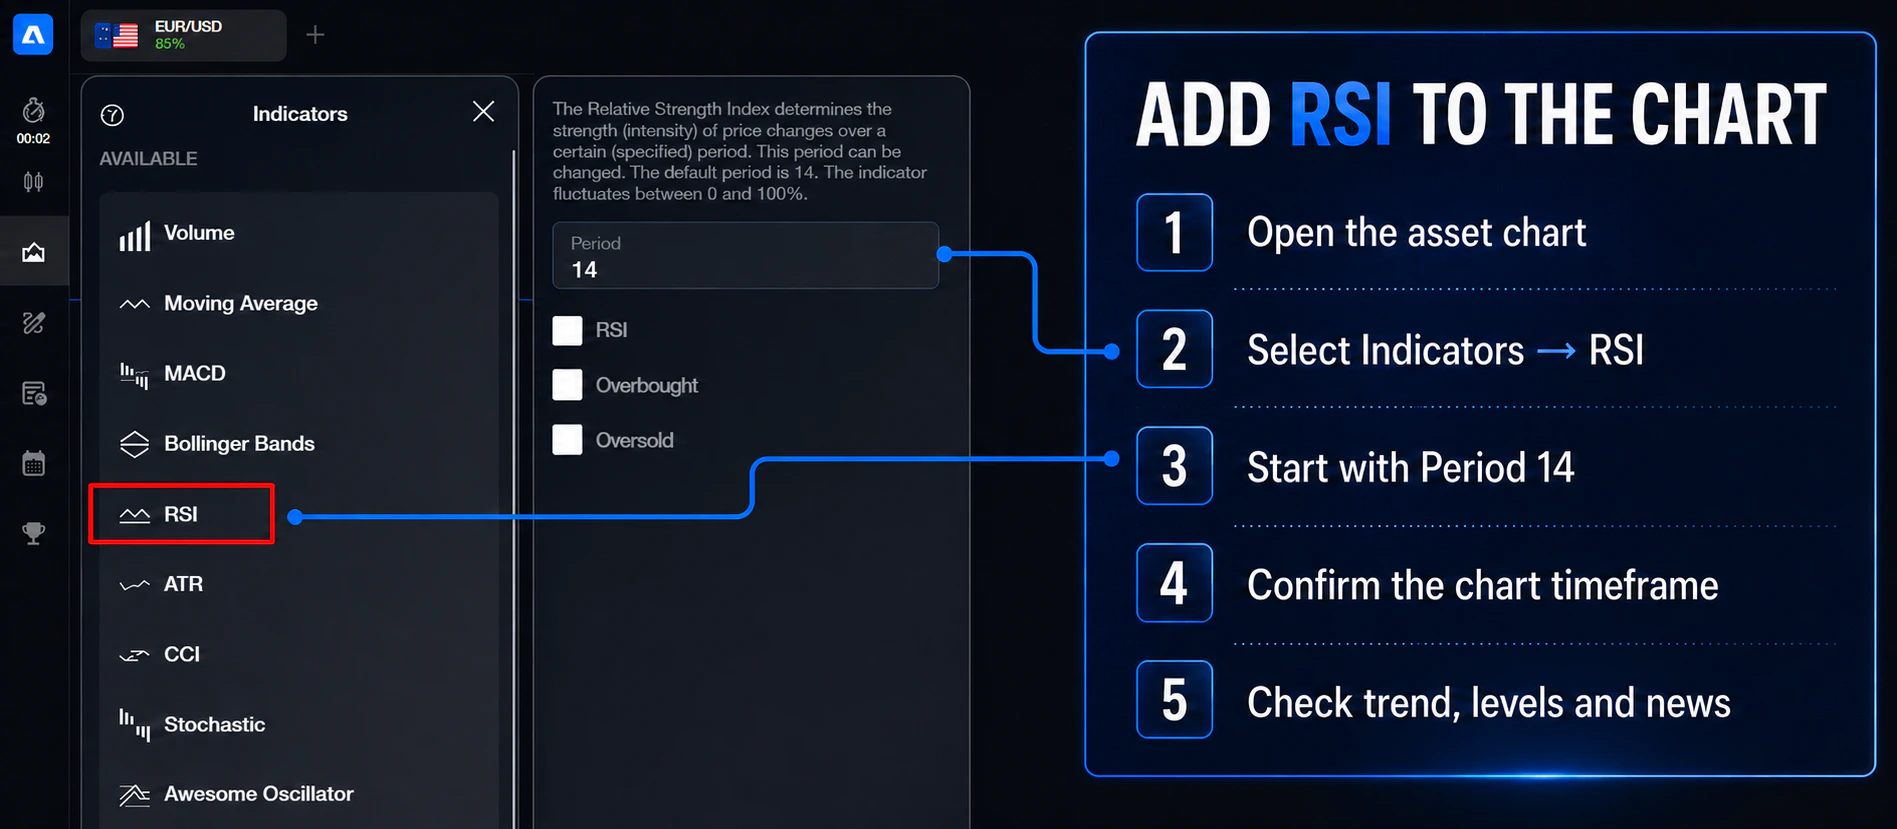
- Open the asset chart. Confirm that the instrument and price source are the ones you intend to analyse.
- Select RSI. Open the indicators menu and choose Relative Strength Index.
- Start with a documented setting. RSI(14) is a common baseline. Record any change instead of adjusting the period after seeing the outcome.
- Confirm the chart period. A setting is meaningful only when paired with the chart period on which it was tested.
- Observe before acting. Mark the current trend or range, nearby support and resistance, and scheduled news before interpreting the oscillator.
Five practical ways to interpret RSI
1. Exit from an extreme zone
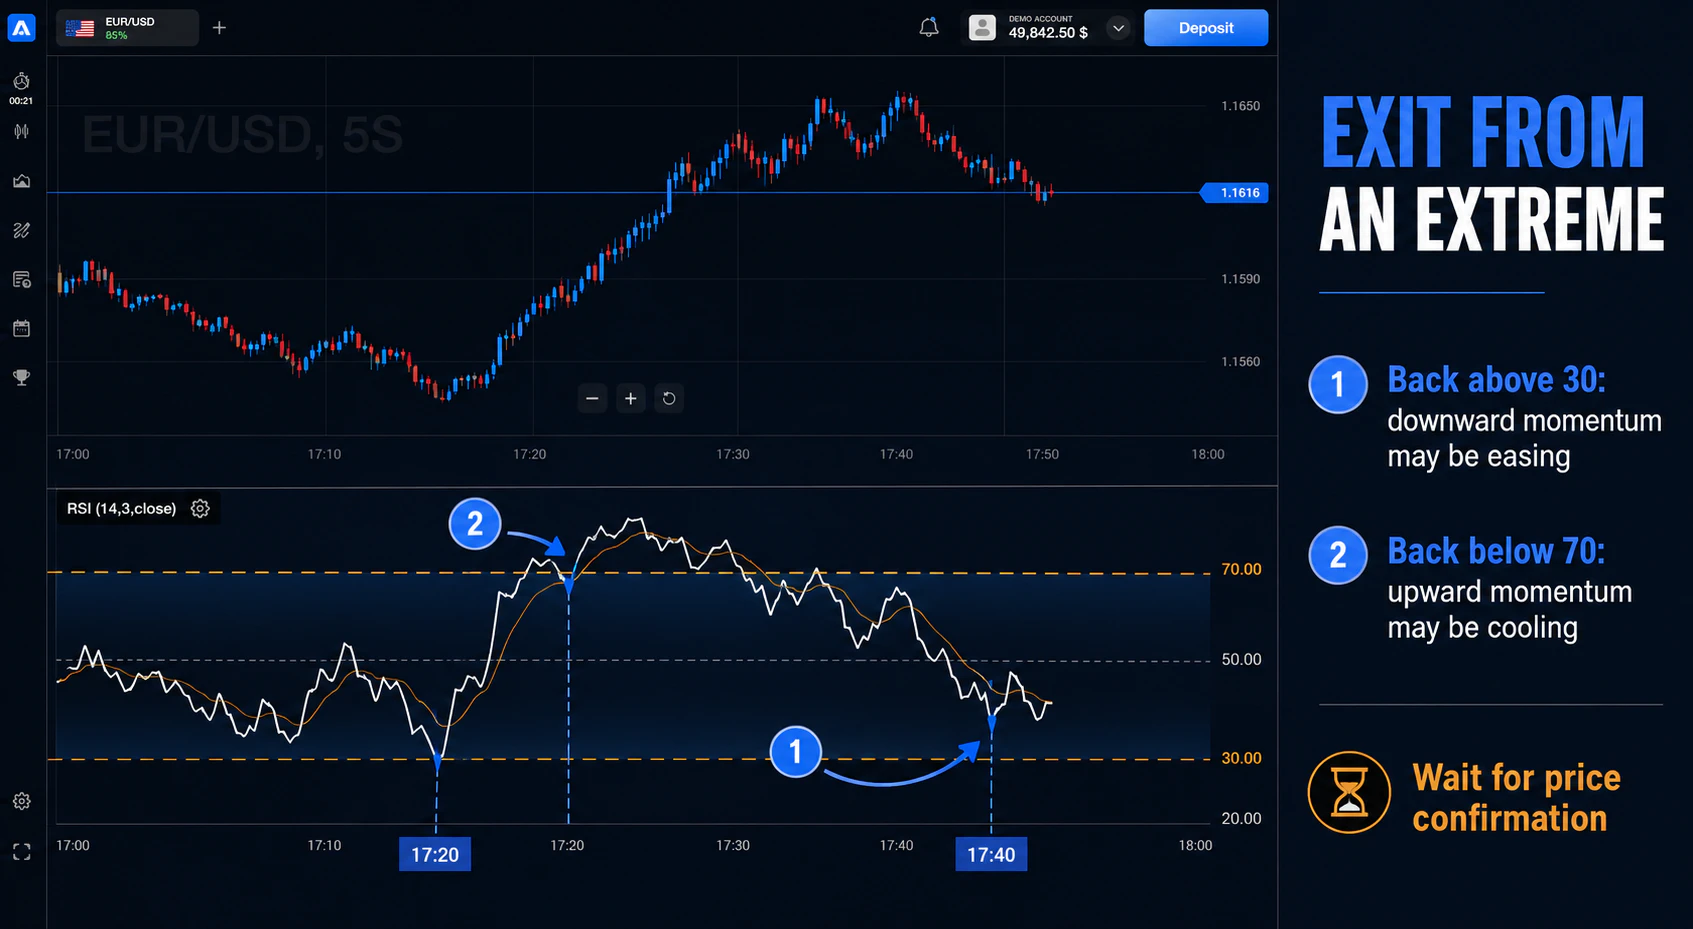
Some traders wait for RSI to leave an extreme zone rather than acting while it is still inside it. For example, RSI moving back above 30 can show that downward momentum has eased. This is more informative when price also rejects a tested support area or closes above a recent minor high.
The reverse applies near the upper zone: a move back below 70 may show that upward momentum has cooled, but it is not sufficient evidence on its own. A clear price-based confirmation rule is needed before the observation becomes a testable setup.
2. Midpoint behaviour
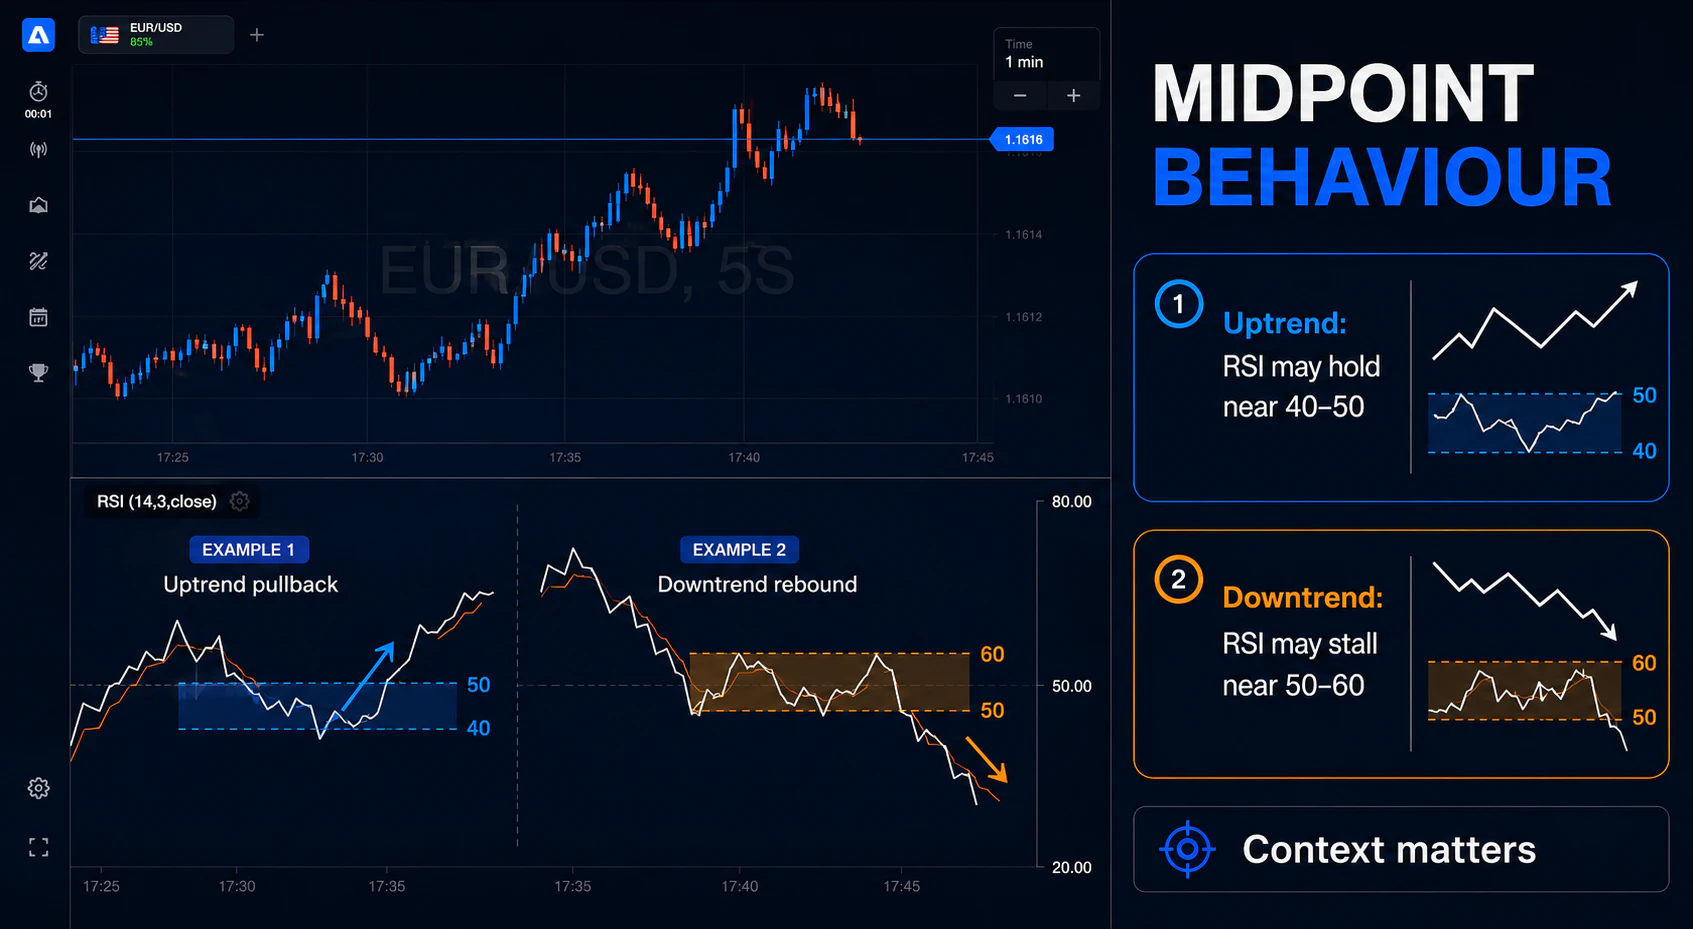
During an established rise, pullbacks may hold near 40–50 before RSI turns higher. During an established decline, rebounds may stall near 50–60 before RSI turns lower. These are tendencies, not fixed laws. Compare them with the asset's own recent range rather than assuming the same levels work everywhere.
3. RSI range shifts
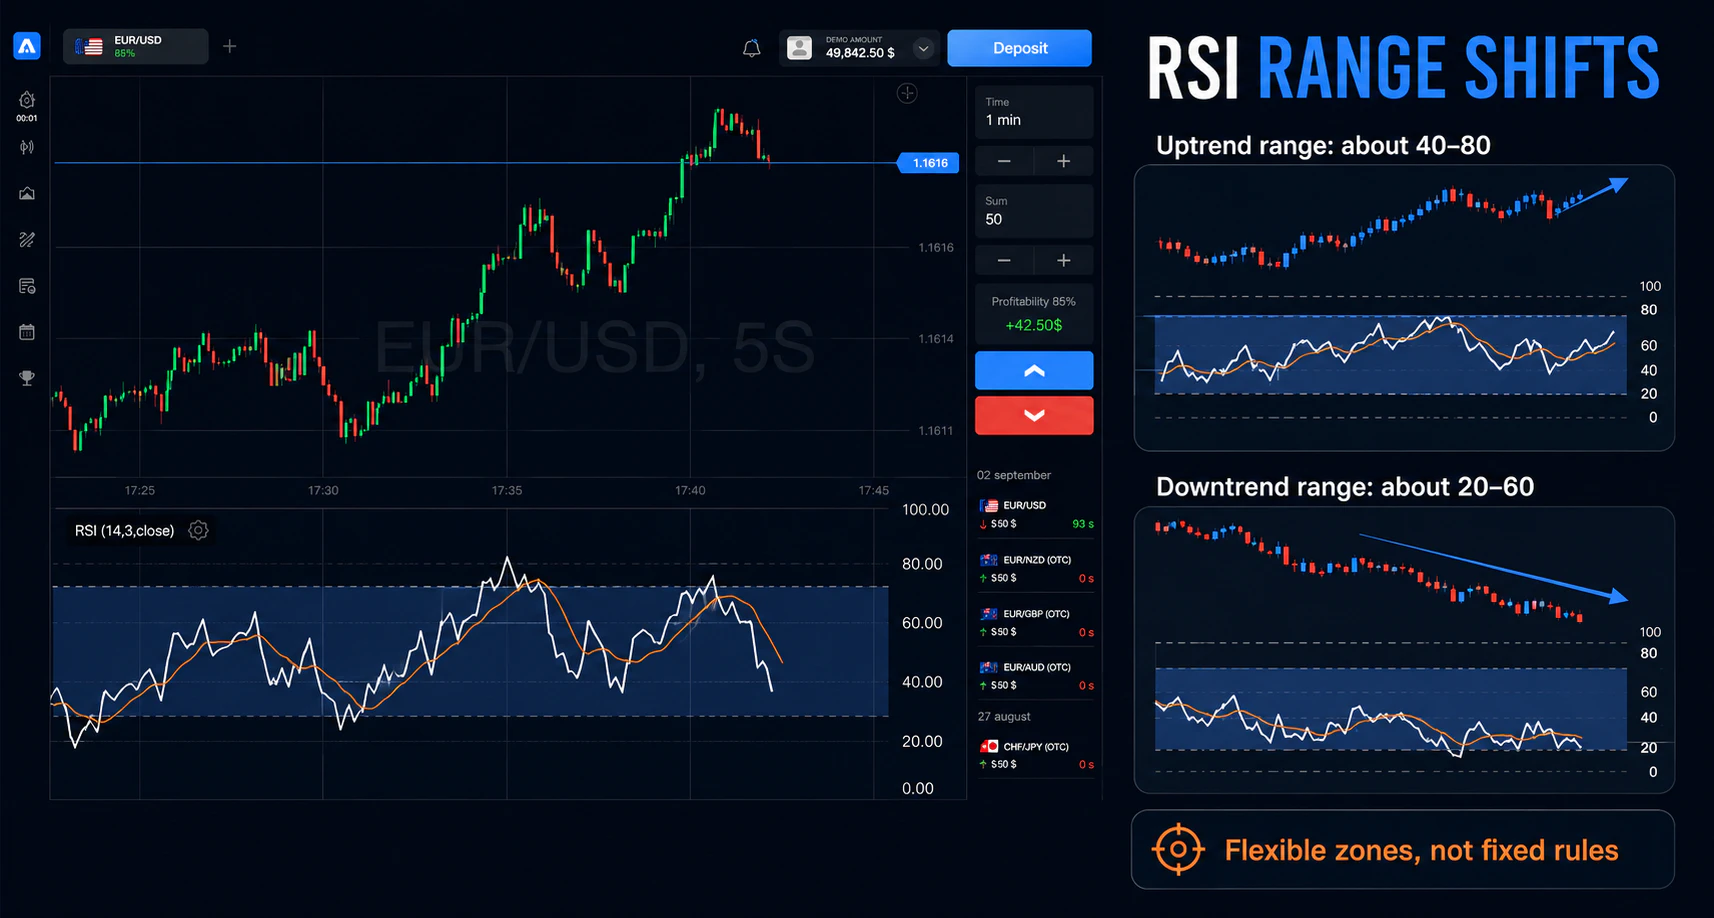
RSI can operate in a higher band during an uptrend and a lower band during a downtrend. Traders sometimes describe an approximate 40–80 range in rising markets and 20–60 in falling markets. Treat these bands as flexible observations: volatility and market regime can change them quickly.
4. Divergence
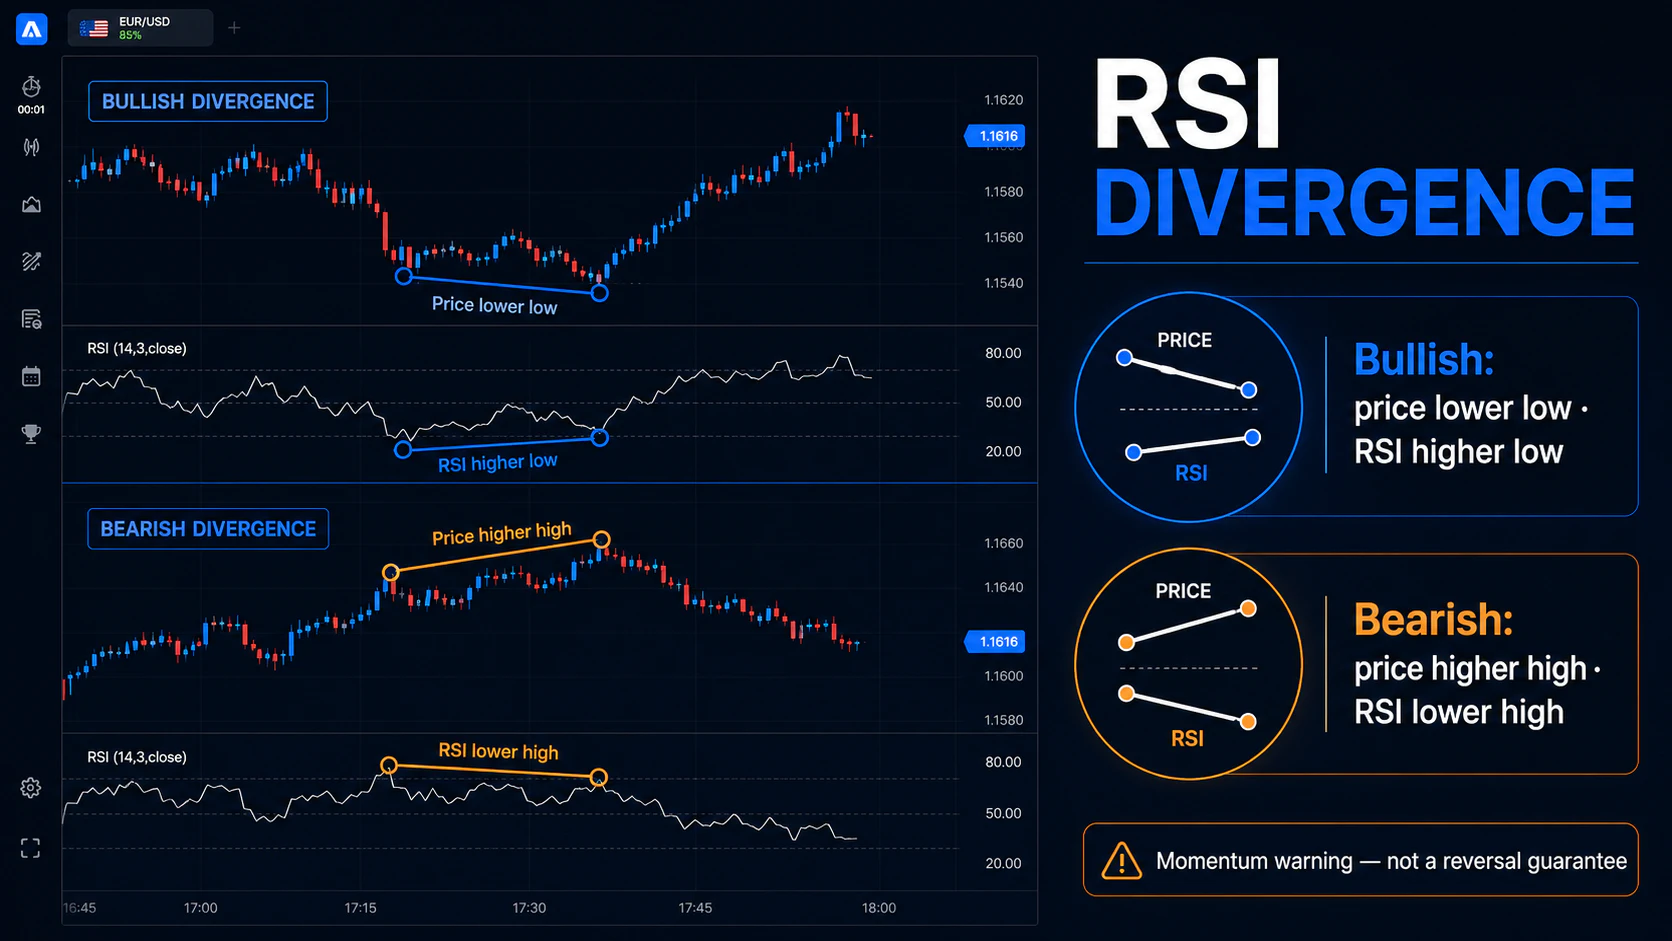
Divergence occurs when price and RSI form different swing structures. It can suggest that momentum is no longer confirming the latest price extreme. It does not identify the exact reversal candle, and a divergence can persist or fail while price continues in the same direction.
| Type | Price | RSI | Possible reading |
|---|---|---|---|
| Regular bullish | Lower low | Higher low | Downward momentum may be weakening |
| Regular bearish | Higher high | Lower high | Upward momentum may be weakening |
| Hidden bullish | Higher low | Lower low | May align with continuation of an uptrend |
| Hidden bearish | Lower high | Higher high | May align with continuation of a downtrend |
Connect comparable swing points. Pairing a minor RSI wiggle with a major price high can create a false comparison. Before using divergence, define how many candles may separate the two pivots and what price confirmation is required.
5. Failure swings
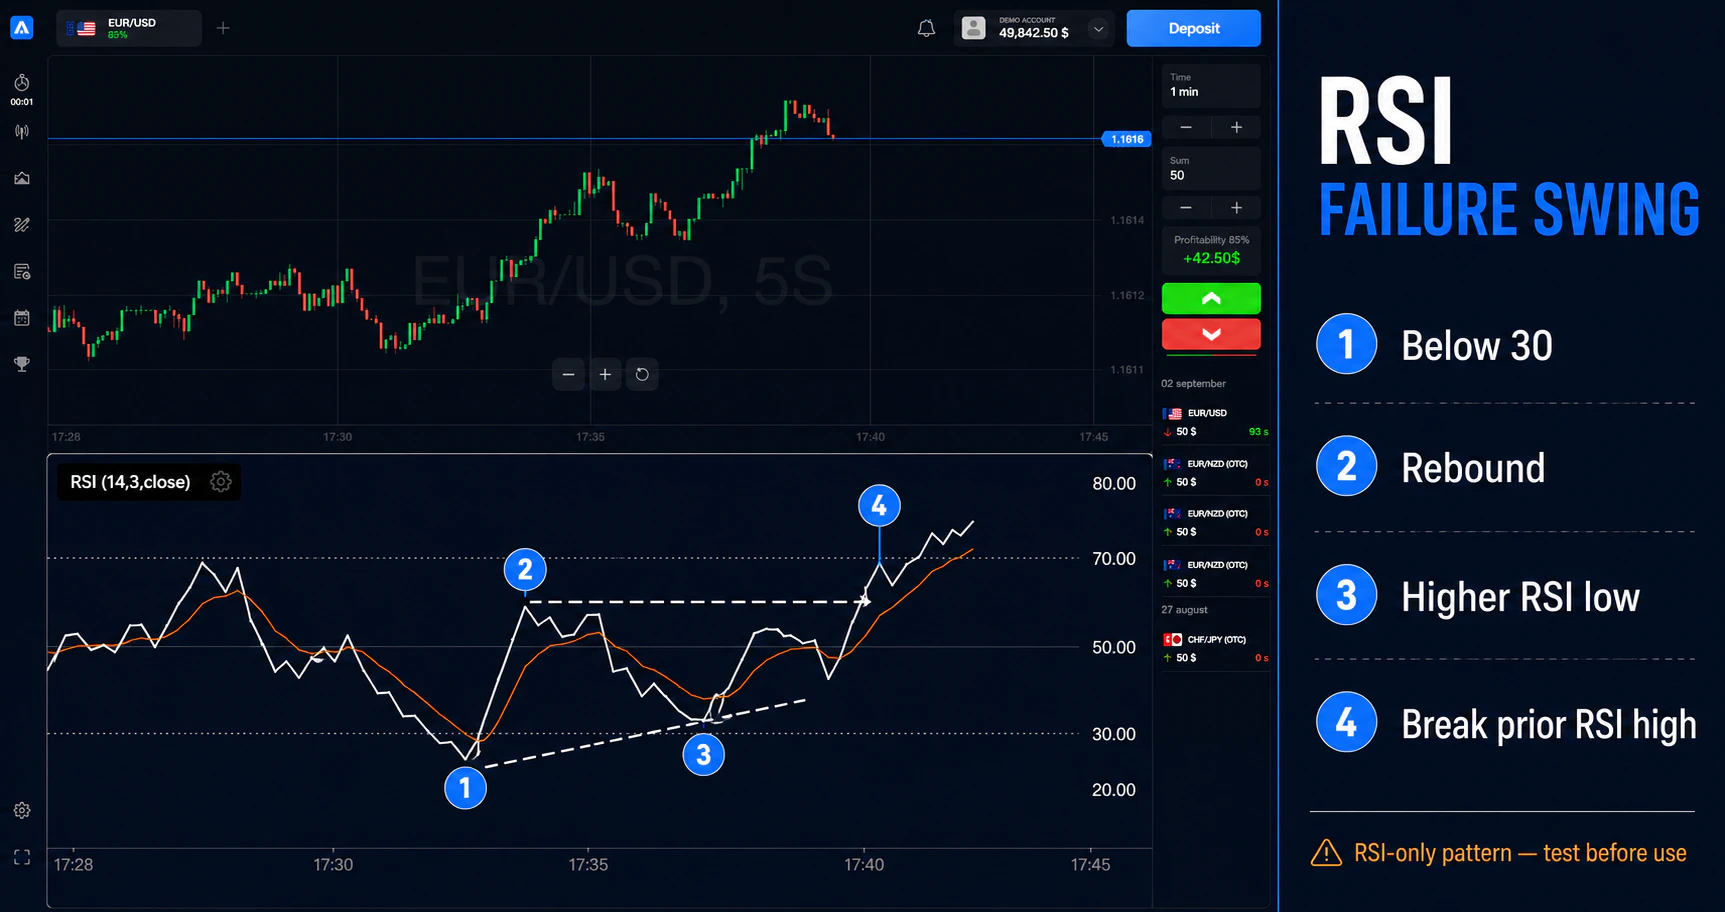
A failure swing is an RSI-only pattern. A bullish version typically forms when RSI drops below 30, rebounds, pulls back without making a new RSI low, and then breaks above the intervening RSI high. A bearish version is the inverse above 70. The pattern describes a momentum sequence; it still requires testing and does not remove market risk.
Choose an RSI setting
| Example period | Typical behaviour | Main trade-off |
|---|---|---|
| 7 or 9 | Reacts quickly to recent price changes | More crossings and more noise |
| 14 | Common balance between speed and smoothing | Still produces false or late signals |
| 21 or longer | Smoother and less sensitive | Can react after much of a move has occurred |
There is no universally best RSI period. Choose one setting for a defined asset, chart period and setup, then test it on a sufficiently large sample. Changing the period until past charts look ideal is curve-fitting and may not hold in new market conditions.
Chart period and expiry must belong to one rule
RSI(14) on a one-minute chart is calculated from a different price sample than RSI(14) on a five-minute chart. When the interface offers several chart periods, use a broader available view to understand context and the chosen working view to define the setup. Record both.
For a fixed-time transaction, the expiry is part of the trading rule. A correct directional idea can still produce a losing result if the move occurs after expiry or reverses before it. Do not choose expiry only because the displayed payout is attractive. Define it in candles or another repeatable unit, test it with the rest of the setup, and confirm the exact expiry time before opening the transaction.
Combine RSI with price information
RSI is usually more useful as one layer of analysis than as a standalone trigger. Suitable confirmation may include:
- Market structure: higher highs and higher lows, lower highs and lower lows, or a clear range.
- Support and resistance: repeated reaction zones, not a single exact price.
- Candlestick confirmation: a completed candle pattern at a relevant area, not an unfinished candle.
- Volatility: enough movement for the setup, without treating extreme volatility as certainty.
- News context: scheduled releases can invalidate a technically neat setup in seconds.
Related guides: Support and Resistance, Candlestick Patterns, Price Action Trading and How Economic News Affects Financial Markets.
A testable fixed-time example
Assume price reaches a support zone and RSI falls below 30. Instead of opening an Up transaction immediately, a written test rule might require all of the following: RSI closes back above 30; price closes above a defined minor swing high; no high-impact release is scheduled during the setup; the trade amount is fixed in advance; and expiry is set according to a previously tested number of candles.
This sequence creates a rule that can be recorded and compared across examples. It does not make the outcome certain. If one condition is missing, the disciplined action is to skip the setup rather than reinterpret the rule after the fact.
RSI versus Stochastic RSI
RSI measures momentum from price changes. Stochastic RSI applies a stochastic formula to RSI values and shows where the current RSI sits within its own recent high–low range. It is therefore more sensitive and can reach extremes more often. Depending on the charting platform, Stochastic RSI may be displayed from 0 to 1 or rescaled from 0 to 100; confirm the scale before applying thresholds.
For a fuller comparison, read Indicators vs Oscillators. Technical labels are not interchangeable, and the same numeric threshold does not mean the same thing across different tools.
Before using RSI on Atlant Trade
- Confirm the asset. Check the exact instrument and whether its price source or trading hours differ from the market you expect.
- Record the chart period. The RSI period and chart period must be stored together.
- Classify the market. Decide whether price is trending, ranging or unusually volatile.
- Mark price structure. Identify support, resistance and recent swing points before reading divergence.
- Check scheduled news. Avoid treating an oscillator as protection from event-driven price gaps or spikes.
- Write the exact trigger. Specify the RSI condition and the price confirmation required.
- Set amount and expiry. Define both before confirmation; do not increase the amount to recover a previous loss.
- Test and journal. Use a demo account first and record every qualifying example, including losing and skipped setups.
Practice resources: Atlant Trade demo account guide and Improving Trading Performance With Controlled Risk.
Common RSI mistakes
- Treating 70 as an automatic Down signal and 30 as an automatic Up signal.
- Ignoring the main trend because RSI appears overbought or oversold.
- Drawing divergence between price and RSI pivots that are not comparable.
- Changing settings after every loss or selecting the setting that best fits a few past examples.
- Reading an unfinished candle as if its RSI value were final.
- Using the same expiry for every chart period without testing the timing.
- Ignoring news, liquidity conditions, platform rules or differences between price feeds.
- Increasing the trade amount after a loss in an attempt to recover quickly.
Frequently asked questions
Is RSI a buy or sell signal?
No. RSI is a momentum measurement. Threshold crossings, divergence and failure swings are observations that require context and a tested decision rule; none guarantees a profitable outcome.
What is the best RSI setting for one-minute charts?
There is no universal best setting. Short settings react faster but create more noise; longer settings are smoother but slower. Test one documented combination of asset, chart period, entry condition and expiry before comparing alternatives.
Can RSI stay overbought or oversold?
Yes. Strong trends can keep RSI in an extreme zone for an extended period. “Overbought” and “oversold” describe momentum conditions, not a deadline for reversal.
Does divergence guarantee a reversal?
No. Divergence may indicate weakening momentum, but price can continue, consolidate or produce several divergences before reversing. Use comparable pivots and a separate price-confirmation rule.
Can RSI be used for fixed-time transactions?
It can be included in a testable setup, but it does not solve the timing problem. The result depends on the platform's entry price, expiry price, payout terms and tie rule as well as market movement. The full trade amount may be lost.
Final takeaway
RSI is most useful when it answers a narrow question: how strong have recent gains been relative to recent losses on this asset and chart period? It becomes more disciplined when combined with price structure, confirmation, a defined expiry rule and fixed risk limits. It becomes dangerous when its levels are treated as promises.
Risk notice: RSI and other technical indicators can produce false or late signals. A fixed-time transaction may lose the full trade amount, and repeated losses may exhaust the account. Past and demo results do not predict future performance. Use only funds you can afford to lose. This material is educational and is not financial, legal or tax advice. Review the Atlant Trade Risk Disclosure before using real funds.