Bollinger Bands Explained: Settings, Squeeze and False Signals
Bollinger Bands are a volatility indicator that places three moving lines around price. Traders use them to study whether volatility is expanding or contracting, where price sits within its recent range, and whether a move is occurring in a trend or a sideways market.
The indicator is useful for organising observations, but it does not predict the next candle or guarantee that price will reverse at an outer band. A Bollinger Band touch is context, not a complete trading signal. This guide explains how the bands work, how to interpret a squeeze or band walk, which settings to test, and why false signals occur.
What are Bollinger Bands?
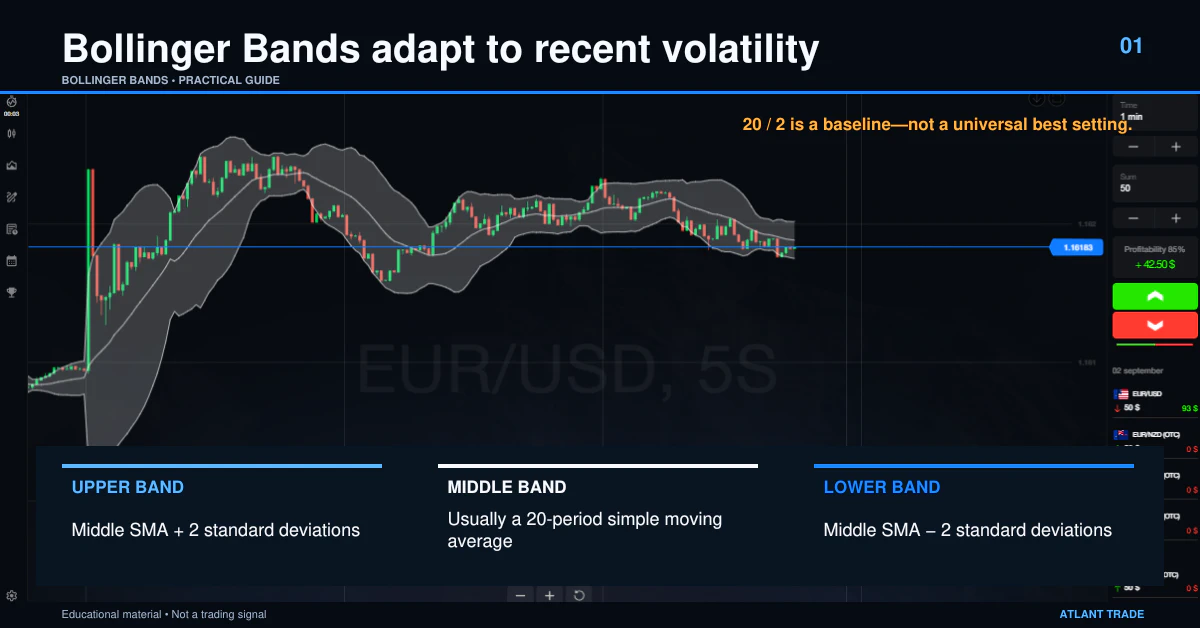
Bollinger Bands were developed by John Bollinger as adaptive trading bands based on volatility. The standard version contains three lines:
- Middle band: usually a 20-period simple moving average of closing prices.
- Upper band: the middle band plus two standard deviations.
- Lower band: the middle band minus two standard deviations.
Middle Band = 20-period SMA
Upper Band = Middle Band + (2 × standard deviation)
Lower Band = Middle Band − (2 × standard deviation)
The settings of 20 periods and two standard deviations are common defaults, not universal best settings. The appropriate configuration depends on the asset, chart interval, market conditions and rules being tested.
Because standard deviation changes with recent price movement, the bands usually widen when volatility increases and narrow when volatility falls. They do not measure the fundamental value of an asset, the probability of a profitable outcome or the direction of the next price move.
What Bollinger Bands show—and what they do not prove
| Observation | What it may show | What it does not prove |
|---|---|---|
| Bands are narrowing | Recent volatility is contracting | That a breakout is immediate or which direction it will take |
| Bands are widening | Recent volatility is expanding | That the current move will continue |
| Price touches an outer band | Price is relatively high or low within the current band structure | That price is overvalued, undervalued or about to reverse |
| Price repeatedly follows one band | A strong directional move may be in progress | That every continuation entry will succeed |
| Price closes outside a band | Momentum and volatility may be increasing | That the move is automatically exhausted |
John Bollinger's official rules emphasise that band tags are not signals by themselves and that price can walk an outer band during a strong trend. A close outside the bands should therefore not be treated as an automatic reversal instruction.
How to add Bollinger Bands to a chart
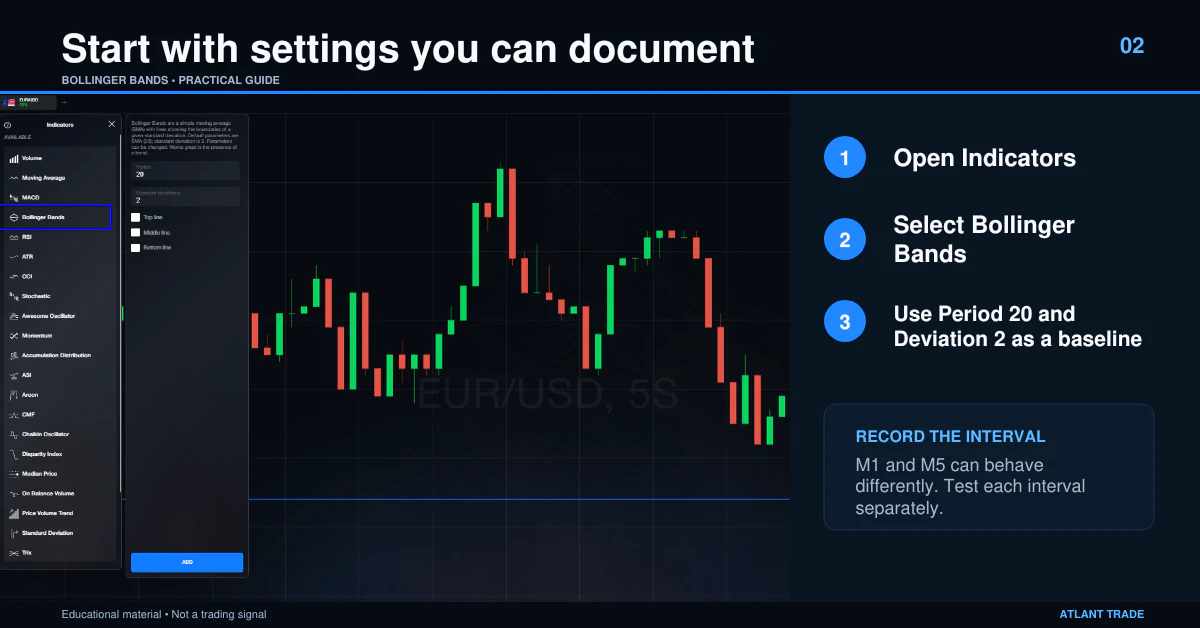
- Open the asset chart. Confirm the instrument, price source and chart interval before analysing it.
- Select Bollinger Bands. Open the indicator menu and add the indicator to the chart.
- Start with a documented baseline. The common starting point is a 20-period SMA with a deviation multiplier of 2.
- Record the chart interval. A setting tested on a one-minute chart cannot be assumed to behave the same way on a five-minute chart.
- Identify market structure. Mark the recent trend or range and nearby support and resistance levels.
- Check scheduled events. Important announcements can cause sudden volatility expansion and price gaps. Read how economic news affects financial markets.
Keep the starting configuration unchanged while collecting observations. Repeatedly changing the period or deviation after seeing the result makes it difficult to tell whether a rule is genuinely useful or merely fitted to past data.
How to read Bollinger Band width
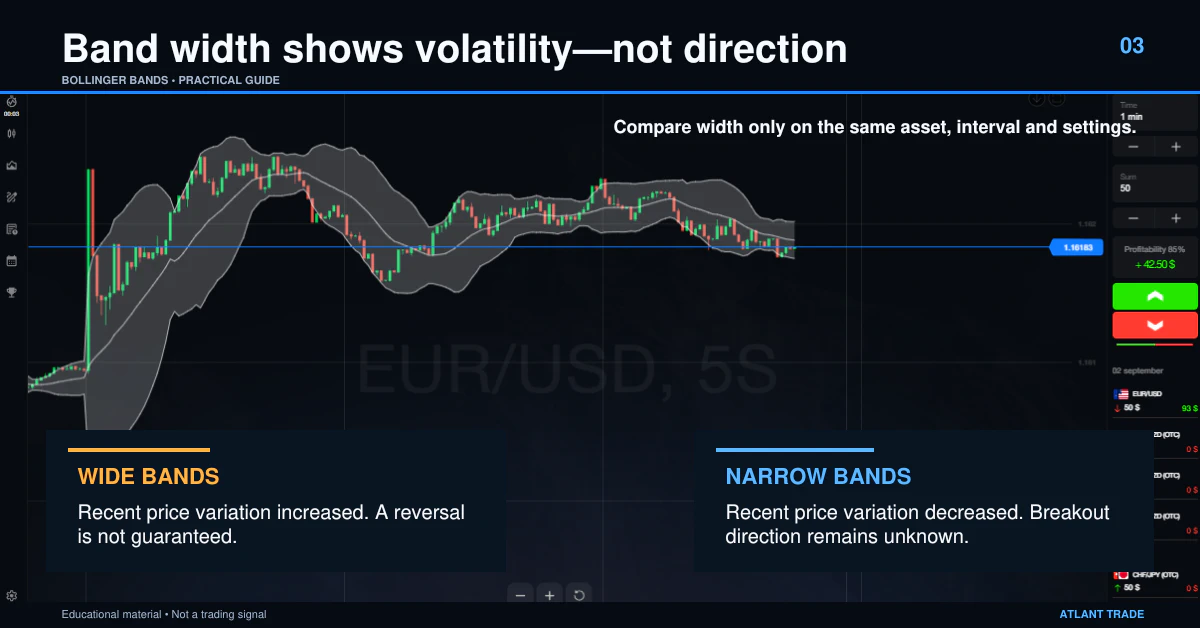
Narrow bands
Narrow bands indicate that recent price variation has decreased relative to the selected settings. This condition is often called volatility contraction. It can occur before a larger move, but it can also persist while price remains quiet. Narrow bands do not reveal breakout direction.
Wide bands
Wide bands indicate increased recent volatility. They often appear during a sharp trend, a news-driven move or unstable two-way trading. Wide bands do not necessarily mean that a reversal is due. They show what volatility has already done within the calculation window.
Always compare width with the same asset, chart interval and settings. A visually wide band on one instrument is not directly comparable with a wide band on another instrument with a different price scale or volatility profile.
What is a Bollinger Band squeeze?
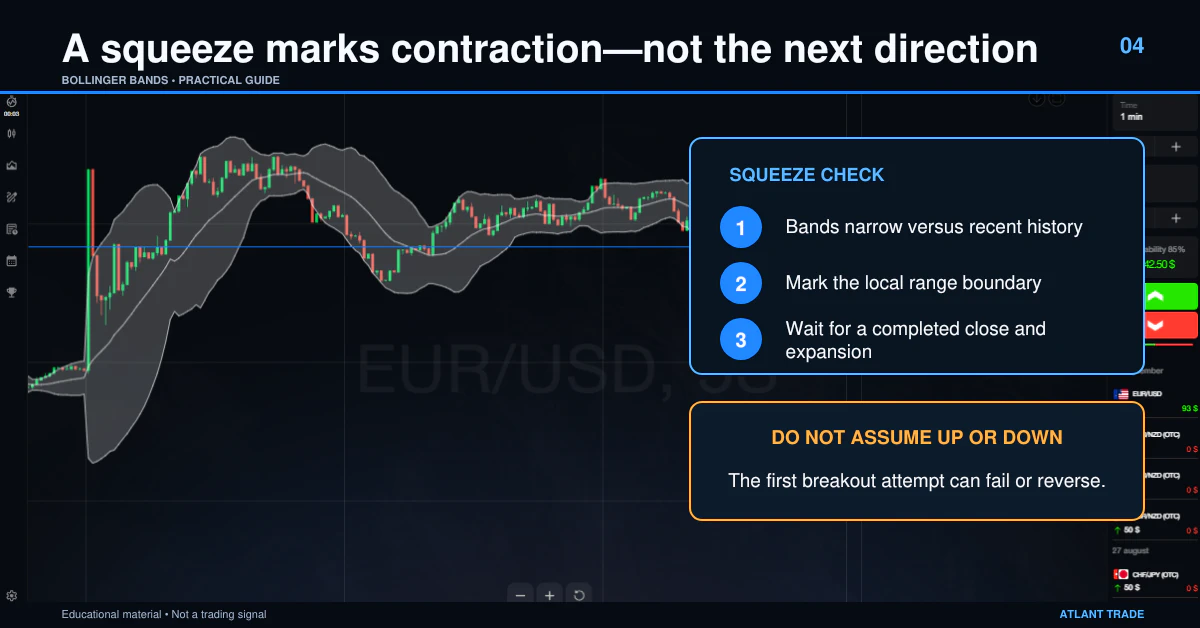
A Bollinger Band squeeze is a period in which the upper and lower bands move unusually close together because recent volatility has contracted. Traders monitor a squeeze for a possible transition from quiet trading to volatility expansion.
A structured squeeze observation may include the following steps:
- Confirm that the bands are narrow relative to their own recent history.
- Mark the boundaries of the local price range.
- Wait for a completed candle to break or close beyond a defined boundary.
- Check whether band width is expanding and whether price structure supports the move.
- Review scheduled news, liquidity conditions and any abnormal price gaps.
- Before entering, define the conditions that cancel the setup and select an expiry according to a tested rule.
The first breakout attempt can fail. Price may briefly leave the range, return inside it and move in the opposite direction. For this reason, the squeeze should be treated as a volatility condition rather than a prediction.
Band walks in strong trends
A band walk occurs when price repeatedly touches or stays close to the upper band in an advance, or the lower band in a decline. This behaviour can persist because the moving average and standard deviation adapt as the trend develops.
- Repeated contact with the upper band may confirm strong upward momentum.
- Repeated contact with the lower band may confirm strong downward momentum.
- A move back toward the middle band may indicate a pause, but it does not establish a reversal.
- The end of a band walk requires price-based confirmation, not only distance from an outer band.
Entering against a band walk simply because price looks high or low can mean trading directly against sustained momentum.
Mean reversion versus breakout
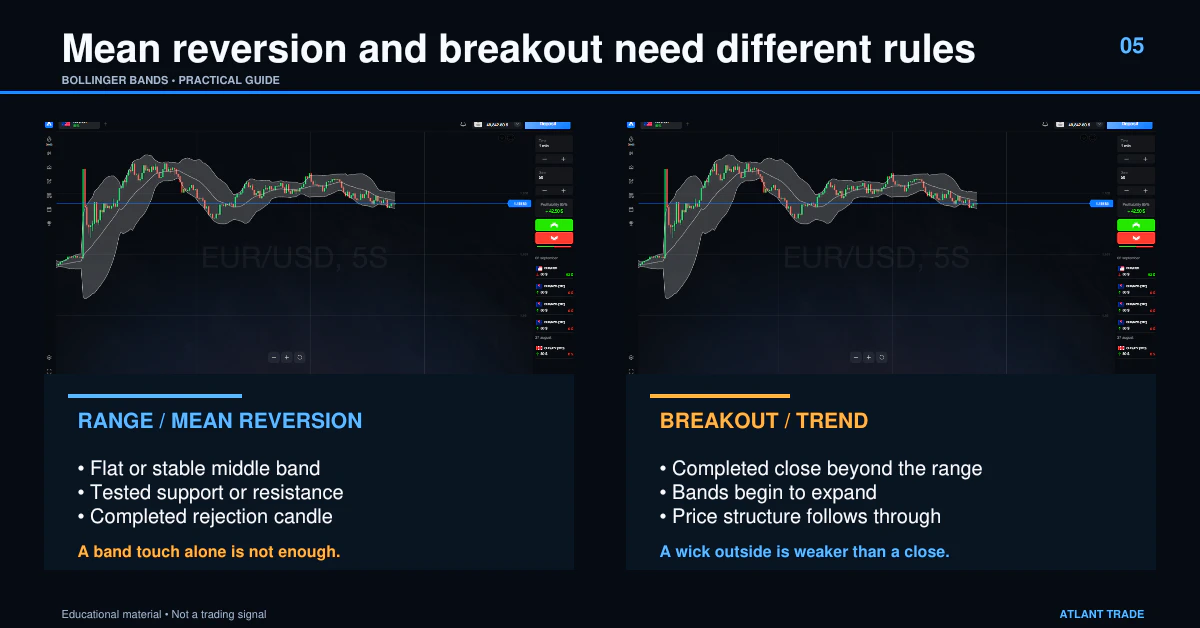
Two common Bollinger Band approaches are mean reversion and breakout observation. They rely on different market conditions and should not be combined without clear rules.
Range and mean-reversion context
When price is moving sideways between established support and resistance, a rejection from an outer band may support the idea of a return toward the middle band. The band touch alone is insufficient. Look for evidence such as a completed rejection candle, a failure to make a new swing extreme or a reaction at a previously tested level.
Mean-reversion logic becomes less reliable when the bands are expanding and price begins to walk one band. In that situation, the apparent extreme may reflect trend strength rather than exhaustion.
Breakout and trend context
After a contraction, a completed close outside the recent range accompanied by expanding bands may indicate that momentum is increasing. Confirmation can include a break of price structure, continued closes in the same direction or a controlled retest of the former boundary.
A single wick outside the band is weaker evidence than a completed candle and follow-through. Even with confirmation, breakouts can fail, especially during thin liquidity or around news releases.
How to interpret the middle band
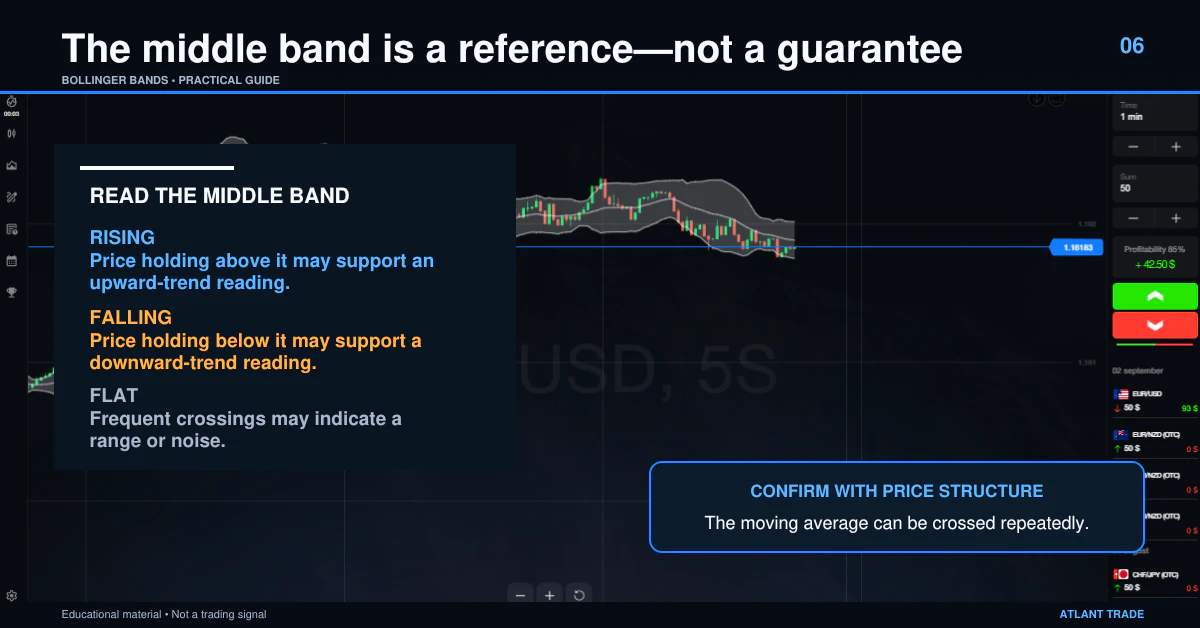
The middle band is usually a moving average, so it can act as a reference for short-term direction and balance:
- Price holding above a rising middle band may support an upward-trend interpretation.
- Price holding below a falling middle band may support a downward-trend interpretation.
- Frequent crossings of a flat middle band may indicate a range or noisy conditions.
- A middle-band reaction is more meaningful when it aligns with price structure and the behaviour of the outer bands.
The middle band is not guaranteed support or resistance. It is calculated from past prices and can be crossed repeatedly.
%B and BandWidth
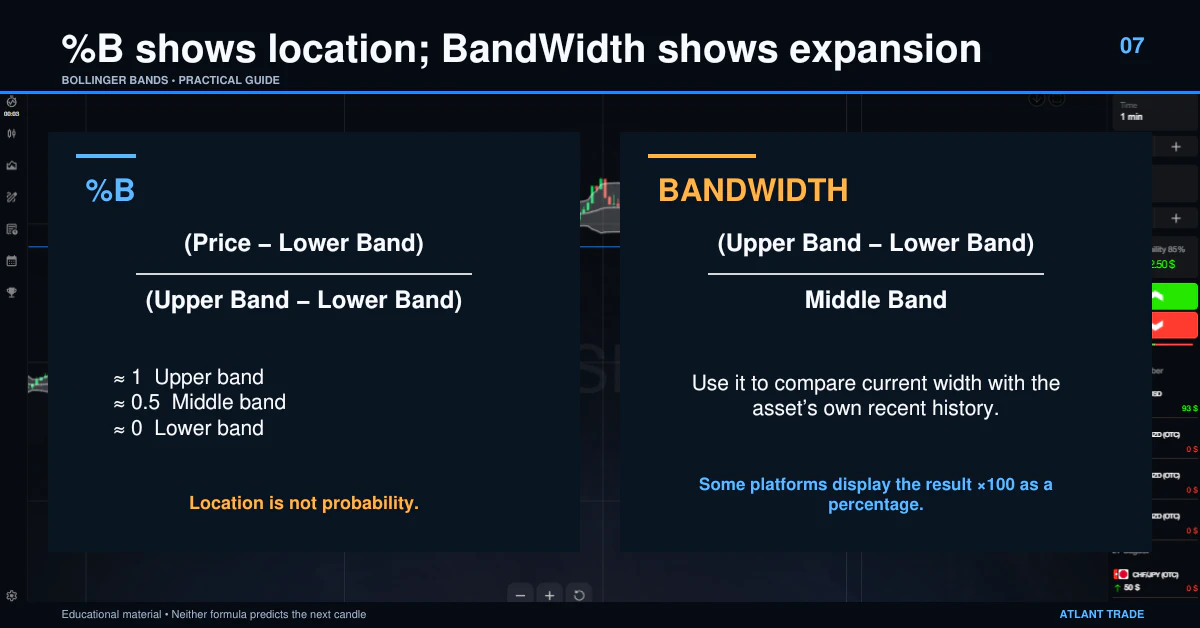
Two related measurements can make Bollinger Band observations more consistent.
%B
%B = (Price − Lower Band) / (Upper Band − Lower Band)
- A value near 1 places price near the upper band.
- A value near 0.5 places price near the middle of the bands.
- A value near 0 places price near the lower band.
- Values above 1 or below 0 indicate that price is outside the bands.
%B describes location, not the probability of the next direction.
BandWidth
BandWidth = (Upper Band − Lower Band) / Middle Band
Some platforms multiply this result by 100 and display it as a percentage. BandWidth can help compare current volatility with the asset's own recent history and define a squeeze with a measurable rule instead of visual judgement alone.
How to choose Bollinger Bands settings
| Adjustment | Typical effect | Main risk |
|---|---|---|
| Shorter moving-average period | Bands react more quickly to recent price changes | More noise and frequent false observations |
| Longer moving-average period | Bands react more slowly and smooth more data | Later recognition of changing conditions |
| Smaller deviation multiplier | Bands sit closer to price | More frequent outside closes and touches |
| Larger deviation multiplier | Bands sit farther from price | Fewer observations and potentially later responses |
Start with one configuration and test it on a defined asset and chart interval. Record the rule, sample period, number of observations, payout conditions and result. Do not select settings only because they would have produced attractive historical outcomes.
Combining Bollinger Bands with RSI and price structure
Bollinger Bands are a volatility-based overlay. RSI is an oscillator that measures the strength of recent gains relative to recent losses. Because the tools describe different features, they can provide complementary context, but agreement between them does not remove risk.
For example, a lower-band test during a range may be more informative if price rejects established support and RSI recovers from a low zone. During a strong decline, however, both price and RSI may remain weak for longer than expected. Learn the distinction between the two tool types in Indicators vs Oscillators.
Price action should remain part of the decision. Completed candles, swing highs and lows, range boundaries and repeated level tests provide information that the bands alone do not contain. The guide to candlestick patterns explains how to evaluate candles without treating a single pattern as certainty.
M-tops and W-bottoms
Bollinger Bands can help describe double-top and double-bottom structures, but the pattern is not complete until price confirms it.
Potential M-top
A potential M-top may form when the first price peak reaches or moves outside the upper band, while the second peak occurs near the first price high but fails to reach the upper band. This can indicate weaker relative momentum. Confirmation still requires a break below the reaction low or another predefined price rule.
Potential W-bottom
A potential W-bottom may form when the first low reaches or moves outside the lower band, while the second low tests a similar price area but remains inside the band. This can indicate improving relative momentum. Confirmation still requires a break above the intervening reaction high or another predefined price rule.
These structures can fail or continue developing. Compare equivalent swing points and avoid forcing the pattern onto minor fluctuations.
Bollinger Bands and fixed-time expiry
In a fixed-time transaction, the result is determined at a specified expiry. Correctly identifying the broader direction is not enough if price has not moved as expected by that exact time.
Suppose a trader identifies a squeeze on a one-minute chart and chooses a one-minute expiry immediately after the first price spike. The move may retrace before expiry even if a broader expansion later develops. A five-minute expiry may allow more time for the setup, but it also exposes the trade to more price fluctuations. Neither choice is inherently safer or more accurate.
Expiry should be part of the tested rule. Record:
- the chart interval used for analysis;
- the type of setup, such as range rejection, squeeze breakout or band walk;
- the required candle or price confirmation;
- the expiry selected before confirmation;
- the displayed payout and applicable settlement rules;
- the outcome, including ties, delayed entries and skipped trades.
Testing one setup across different expiry choices is more informative than changing the expiry after each result. A demo account can help users learn the interface and document a method, but demo performance does not reproduce every live condition and does not predict future results.
Why Bollinger Band false signals occur
Trading every outer-band touch
An outer-band touch identifies a relative price location. During a strong trend, repeated touches may reflect continuation rather than reversal.
Acting before the candle closes
A candle may move outside a band and return before close. Rules based on completed candles should not be evaluated using an unfinished candle.
Ignoring market regime
A range-rejection rule and a breakout rule are designed for different conditions. Applying both to the same observation can create contradictory decisions.
Using an expiry that does not match the setup
A valid observation can still produce an incorrect fixed-time result if normal price fluctuation occurs before expiry or the expected move develops later.
Ignoring economic events
Scheduled announcements can rapidly widen the bands and invalidate observations based on quieter conditions. Unexpected news can do the same without warning.
Overfitting the settings
Adjusting the period, deviation and confirmation rules until past charts look perfect creates a model that may not survive new data.
Risking too much on one idea
No indicator removes the possibility of a full loss of the trade amount. Risk should be planned independently from the confidence attached to a setup. Read Improving Trading Performance With Controlled Risk.
Practical Bollinger Bands checklist
- Confirm the asset, price source and chart interval.
- Record the Bollinger Bands period and deviation multiplier.
- Classify the market as trending, ranging or unclear.
- Check whether the bands are contracting, stable or expanding.
- Mark nearby support, resistance and recent swing points.
- Decide whether the rule is based on mean reversion or breakout behaviour.
- Wait for the predefined price or candle confirmation.
- Check scheduled news and abnormal volatility.
- Choose the trade amount and expiry before entering.
- Skip the trade if the setup is unclear or the displayed conditions do not match the tested rule.
Common Bollinger Bands mistakes
- Treating the upper band as an automatic sell instruction.
- Treating the lower band as an automatic buy instruction.
- Assuming a squeeze predicts direction.
- Assuming wide bands mean a reversal is due.
- Changing settings after every losing observation.
- Mixing results from different assets and chart intervals.
- Ignoring the difference between a wick outside a band and a completed close.
- Entering against a band walk without price confirmation.
- Choosing expiry after seeing the first price movement.
- Increasing the trade amount to recover a previous loss.
Frequently asked questions
What are the best Bollinger Bands settings?
There is no universally best setting. A 20-period simple moving average with a two-standard-deviation multiplier is a common baseline. Test one documented configuration on the relevant asset, interval and market conditions before comparing alternatives.
Does touching the upper Bollinger Band mean price will fall?
No. A touch means that price is high relative to the current band structure. During strong upward momentum, price can repeatedly touch or follow the upper band.
Does touching the lower Bollinger Band mean price will rise?
No. Price can continue falling while following the lower band. A reversal idea requires additional price-based evidence and remains uncertain.
Does a Bollinger Band squeeze guarantee a breakout?
No. A squeeze shows that recent volatility has contracted. Expansion may follow, but the timing and direction are unknown, and the first breakout attempt may fail.
Can Bollinger Bands be used alone?
They can organise volatility observations, but using only the bands omits market structure, price behaviour, news and risk. Combining unrelated indicators does not guarantee a correct result either.
Are Bollinger Bands suitable for short chart intervals?
They can be calculated on short intervals, but shorter charts often contain more noise, spread effects and rapid changes. Settings and expiry rules should be tested specifically for the interval being used.
Do Bollinger Bands repaint?
The current bands change while the latest candle and calculation window update. Values on completed historical candles are based on the data available for those periods, but the newest observation can continue changing until the candle closes.
Final takeaway
Bollinger Bands provide a structured view of relative price location and recent volatility. Narrow bands may identify contraction, expanding bands may confirm increasing volatility, and a band walk may accompany a strong trend. None of these observations predicts the next candle by itself.
Use documented settings, distinguish range logic from breakout logic, require price confirmation and test expiry rules separately. The aim is not to eliminate uncertainty but to make each decision clear enough to review.
Risk notice: Bollinger Bands and other technical indicators can produce false, late or conflicting observations. A fixed-time transaction may result in the loss of the full trade amount, and repeated losses may exhaust the account. Past and demo results do not predict future performance. Use only funds you can afford to lose. This material is educational and is not financial, legal or tax advice. Review the Atlant Trade Risk Disclosure before using real funds.