What Is Price Action Trading?
Price action trading is the practice of analysing a market using the movement of price itself — its highs, lows, opens, closes, and the shapes it forms on a chart — rather than relying primarily on calculated indicators. The idea is that price already reflects the combined buying and selling activity in a market, so studying it directly can reveal useful context about direction, momentum, and potential turning points.
This doesn't mean price action is a shortcut to certainty. Interpreting price is subjective, and the same chart can be read differently by different traders. Price action is a way of organizing observations about the market, not a system that removes uncertainty.
What Information Does Price Itself Contain?
Every completed period on a chart — a minute, an hour, a day — leaves behind four numbers: the open, the high, the low, and the close, commonly abbreviated as OHLC. Together, these numbers describe what happened during that period: where the price started, how far it moved in each direction, and where it ended up.
Two of the most detailed practical applications of these ideas are covered in support and resistance in trading and candlestick patterns: how to read price action.
A candlestick is simply a visual representation of these four numbers. The wide part, called the body, shows the range between the open and close. The thin lines above and below, called wicks or shadows, show the highest and lowest prices reached during the period.
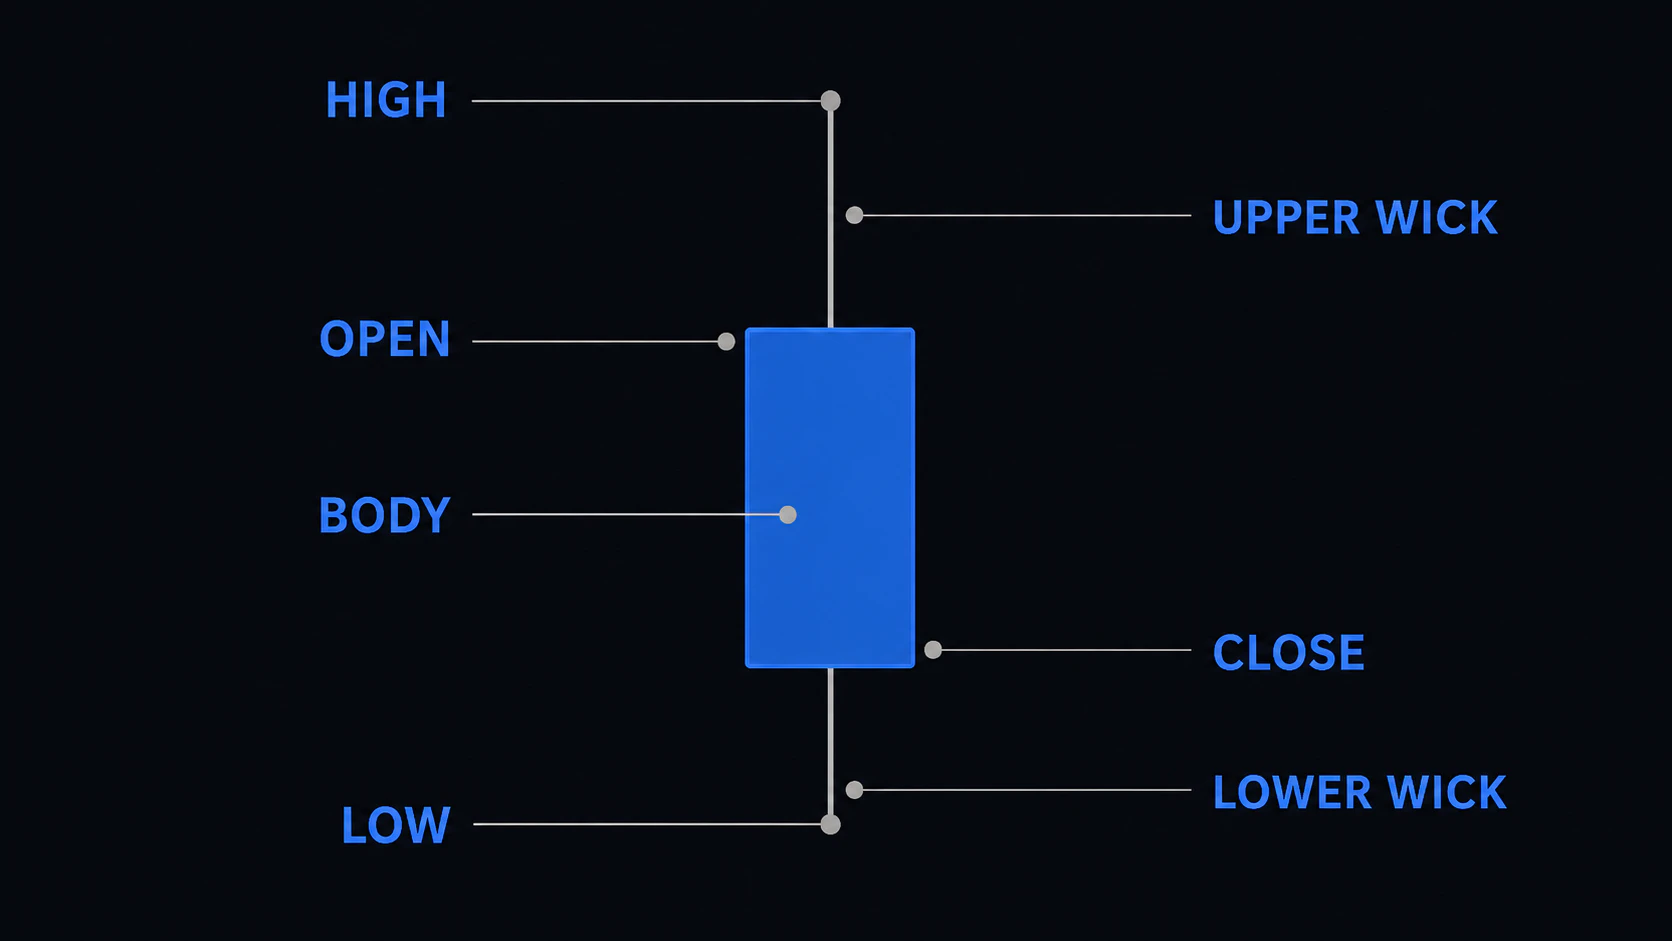
Candlestick Structure
A candle with a large body and small wicks suggests that one side — buyers or sellers — was in control for most of the period. A candle with a small body and long wicks suggests that price moved significantly in both directions before settling closer to where it started, which may indicate indecision or a contest between buyers and sellers.
A more detailed breakdown of individual candlestick shapes and what they may indicate is covered separately in how to identify trade entry points and signals.
Swing Highs and Swing Lows
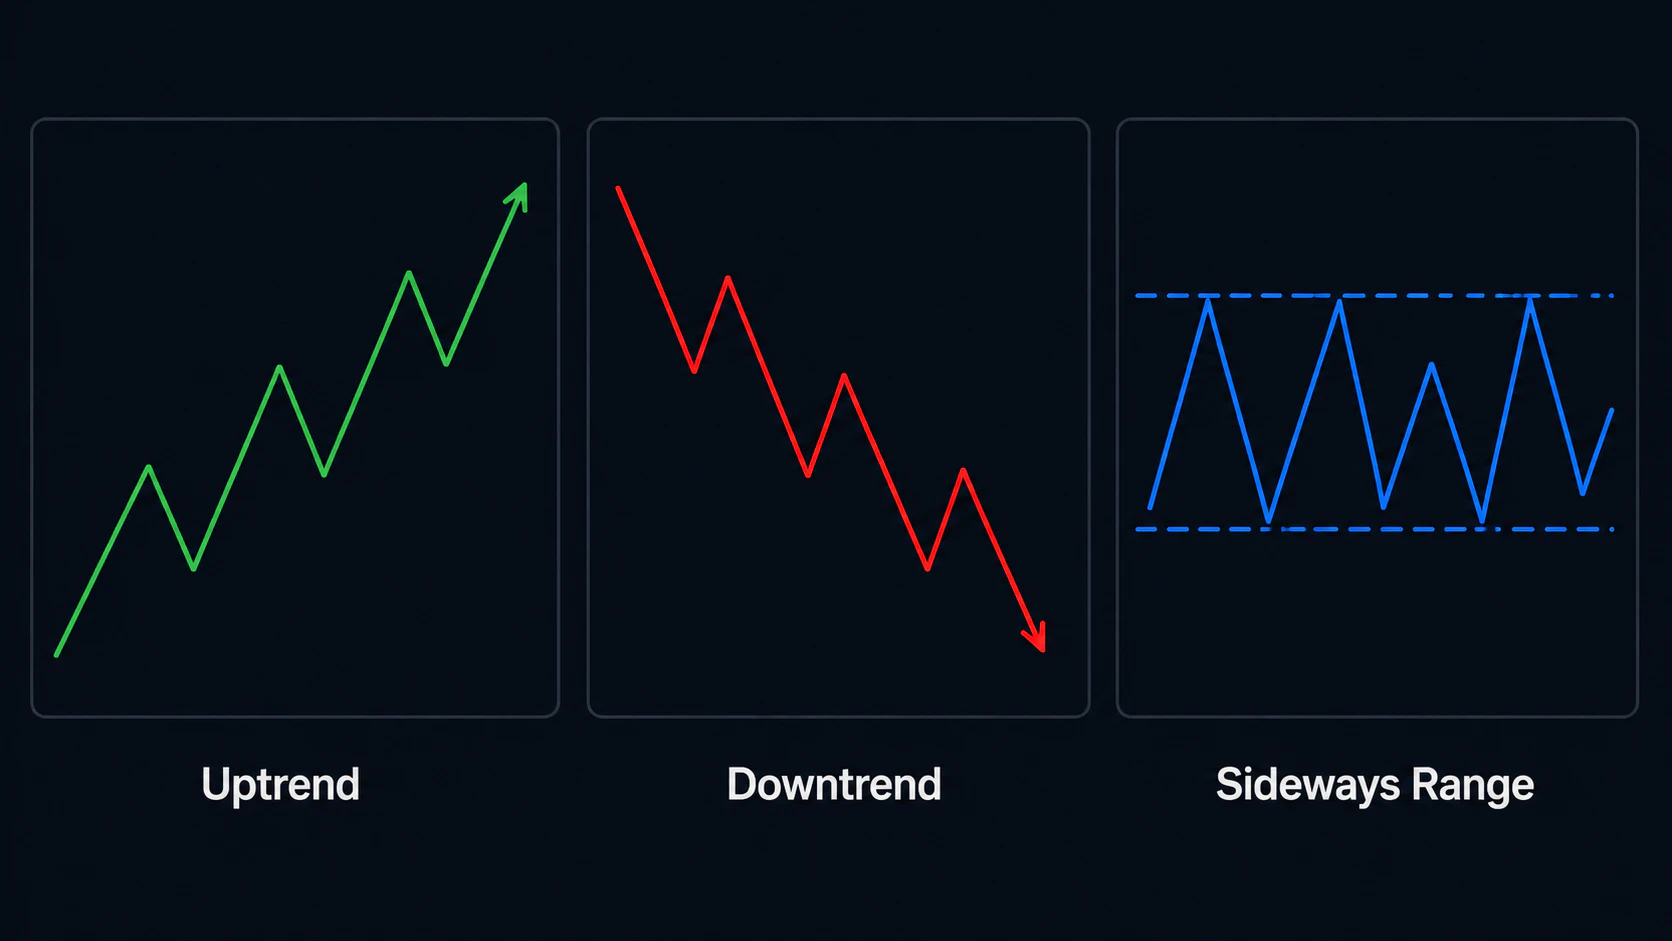
A swing high is a peak where price rises and then turns downward, forming a point that is higher than the candles immediately before and after it. A swing low is the opposite — a trough where price falls and then turns upward. These points are the basic building blocks used to describe market structure.
Trends and Ranges
When swing highs and swing lows are each progressively higher than the ones before them, the market is generally described as being in an uptrend. When they are progressively lower, the market is in a downtrend. When highs and lows stay within a roughly similar band without a clear progression, the market is considered to be ranging or moving sideways.
These labels describe what has already happened. They do not guarantee what will happen next — a trend can end, and a range can break in either direction without advance warning.
Momentum
Momentum in a price-action context often refers to the size and consistency of recent candles. A series of large candles in the same direction with small pullbacks may suggest strong momentum. A series of small, overlapping candles may suggest weakening momentum or hesitation. This is a qualitative observation rather than a precise measurement, and different traders may judge it differently.
Support and Resistance
Support refers to a price area where a decline has previously slowed or reversed, suggesting a concentration of buying interest. Resistance refers to a price area where an advance has previously slowed or reversed, suggesting a concentration of selling interest. These are usually treated as zones rather than exact prices, since reactions rarely occur at a single precise level twice.
Breakouts and False Breakouts
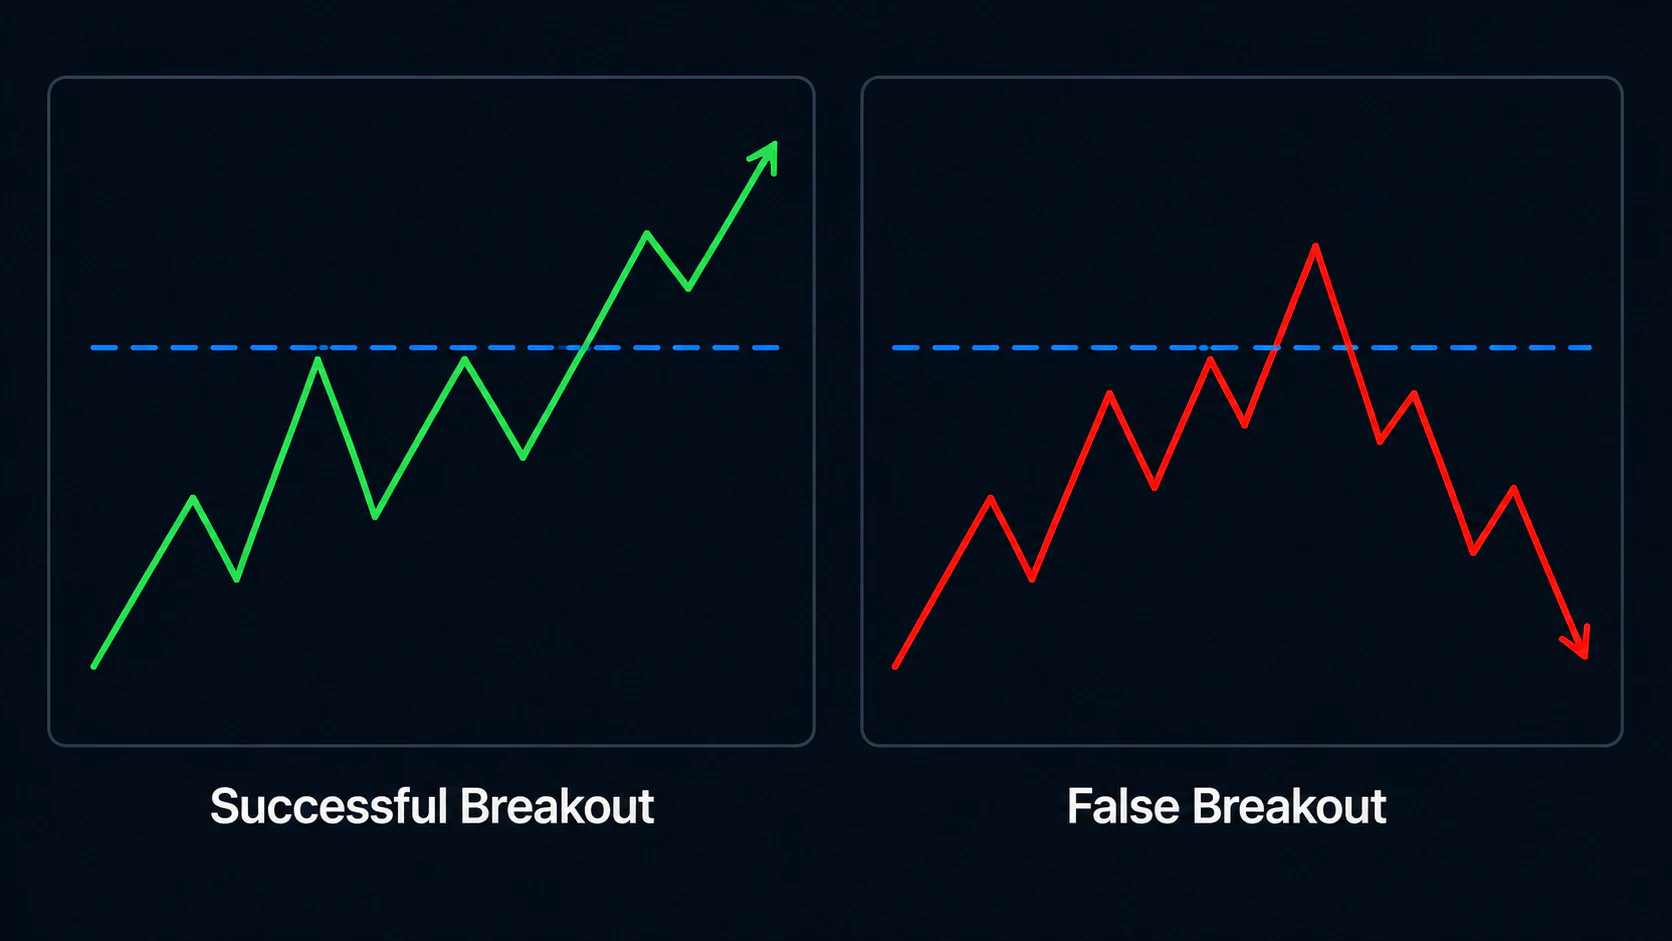
A breakout occurs when price moves beyond a previously established support or resistance zone. Some breakouts continue in the new direction; others reverse shortly afterward, which is commonly called a false breakout or a fakeout. Because both outcomes are common, many traders look for additional confirmation — such as a candle closing beyond the level, or a retest of the broken zone — before treating a breakout as significant.
Pullbacks
A pullback is a temporary movement against the prevailing trend. In an uptrend, this means a short-term decline before the broader upward movement potentially resumes. Pullbacks are a normal part of trending markets, but a pullback can also develop into a full reversal, so treating every pullback as temporary is not a safe assumption.
Rejection
Rejection refers to price moving into a level and then being pushed back the other way within the same period, often leaving a long wick. This can suggest that the level attracted opposing orders strong enough to reverse the move, but a single rejection candle is not proof that the level will hold in the future.
Continuation and Reversal Context
A continuation pattern is a pause or consolidation that resolves in the same direction as the prior trend. A reversal pattern is a shift that ends the prior trend and starts a move in the opposite direction. Distinguishing between the two in real time is difficult — a pattern often only becomes clearly identifiable as continuation or reversal after the fact.
Market Structure
Market structure refers to the overall arrangement of swing highs and swing lows that defines the current trend or range. A structural shift — for example, the first lower high in what had been a series of higher highs — is sometimes used as an early signal that the prevailing trend may be weakening, though it is not a guarantee of a full reversal.
Multi-Timeframe Context
The same instrument can show different structures on different timeframes. A short-term chart might show a downward move that is simply a pullback within a longer-term uptrend visible on a higher timeframe. Many price-action traders check a higher timeframe for overall context before analysing a shorter timeframe for a specific setup, to avoid interpreting a temporary move as a full trend change.
Price Action vs. Indicators
Price action and technical indicators are not mutually exclusive approaches, and price action should not be treated as inherently superior to indicator-based analysis. Indicators are calculations derived from price and volume that can help summarise information — such as momentum or volatility — in a standardised way. Price action is a more direct, visual reading of the same underlying data.
Neither approach allows a trader to read the market with certainty. Both involve interpretation, and both produce false signals. Many traders use price action to establish context — such as trend direction or a relevant support and resistance zone — and use indicators to add a separate layer of confirmation, rather than relying on either in isolation.
For an example of how price structure and indicator confirmation can be combined in an entry framework, see how to identify trade entry points and signals.
A Simple Example
Consider a market making a series of higher highs and higher lows — an uptrend by the definition above. Price pulls back toward a previously established support zone and then forms a candle with a long lower wick and a close near the top of its range, which some traders would describe as a rejection candle. This combination — trend, location, and a rejection shape — is the kind of observation price-action traders look for. It describes a possible scenario, not a certainty; the pullback could still continue lower and invalidate the idea.
Common Mistakes
- Treating a single candlestick pattern as a standalone signal without considering its location or the broader trend
- Assuming a level must hold simply because price reacted to it once before
- Confusing a temporary pullback with a confirmed trend reversal
- Ignoring the higher timeframe context and reacting only to short-term moves
- Believing that price action removes the need for a risk-management plan
Limitations
Price action analysis is interpretive. Two traders can look at the same chart and reach different conclusions about the trend, the relevant levels, or the meaning of a particular candle. False signals — apparent setups that do not play out as expected — are a normal and unavoidable part of this kind of analysis, not a sign that it is being done incorrectly.
Risk Considerations
Because no price-action read is certain, any trade based on it should be accompanied by a plan for what happens if the read is wrong — a predefined point at which the idea is considered invalidated, and a predetermined limit on how much is risked if that happens.
These risk-planning principles are covered in more depth in improving trading performance with controlled risk.
Summary
Price action trading means analysing the raw movement of price — its candles, swings, trends, and reactions at key levels — to build context about a market. It is a way of organising observation, not a predictive tool, and it works alongside rather than in place of other forms of analysis. Like any method of market analysis, it produces false signals and does not remove the underlying uncertainty of trading.
Ready to see these concepts on a live chart without risking real funds? Open a free Atlant Trade demo account