How to Test a Trading Strategy: Backtesting and Forward Testing
A few successful trades do not establish that a trading strategy works. To evaluate an idea, you need to define its rules in advance, test them on a chronological sequence of data, and account for losses, missed signals, and the limitations of the test itself.
Two approaches can help: backtesting and forward testing. Backtesting examines how a strategy would have behaved on historical data. Forward testing follows the strategy as new prices become available, before the outcome of the next trade is known.
You can use the Atlant Trade demo account for forward testing: apply your rules under current demo conditions, record the parameters of practice trades, and compare the results with your original expectations.
The purpose of testing is to understand whether you can apply a rule consistently and what the collected evidence actually supports.
What Is the Difference Between Backtesting and Forward Testing?
Backtesting means evaluating a strategy using historical data. You examine past situations in chronological order and calculate the results that trades might have produced under predefined conditions. This is a simulation, rather than a record of trades that were actually executed.
Forward testing means evaluating a strategy as new data arrives. You record each decision before its outcome becomes known. Beginners can conduct this type of test on a demo account using virtual funds.
| Factor | Backtesting | Forward testing |
|---|---|---|
| Data used | Historical prices | New prices as they become available |
| When decisions are made | During a chronological review of historical data | Before the future outcome is known |
| Main objective | Evaluate a rule over a past period | Evaluate the application of the same rule under new conditions |
| Main limitation | The risk of overfitting or using information from the future | The need to wait for signals and follow the rules without changing them |
| What the result does not establish | Future profitability | That demo results will match live trading results |
These approaches complement each other. A positive historical result is a reason to investigate further, not an automatic reason to start trading with real money.
Start with a Rule You Can Test
A statement such as “open a trade when the price looks strong” is too vague. Once the outcome is known, almost any movement can be explained in hindsight.
A testable rule should allow you to assess similar situations consistently.
Before starting the test, record:
- The exact asset label and price source.
- The chart timeframe.
- The conditions that create a signal.
- The point after which entry is permitted.
- The trade direction.
- The expiry.
- The amount allocated to each practice trade.
- The conditions under which a signal must be skipped.
- The maximum number of simultaneously open trades.
- The method for determining results and accounting for costs.
If you use an indicator, record its period, additional settings, and whether its value is assessed only after the candle has closed.
An Example of a Written Practice Rule
Instead of “open Up after a breakout,” you could write:
On a one-minute chart, a completed candle closes above the highest high of the previous five completed candles. An Up practice trade may be considered after that candle closes. Only one trade may be open at a time. The expiry and virtual trade amount are selected before testing and remain unchanged throughout the test series.
This illustrates how to make a condition observable. It is not a recommendation to use this particular strategy.
You must also define the entry model: which quote to use after the signal candle closes and how to account for any delay. You cannot wait for confirmation at the candle close and then record an entry at a more favourable price that was available earlier.
If your idea depends on price levels, first define how you identify support and resistance. Those levels must not be moved after the outcome becomes known.
What Data Does a Reliable Test Require?
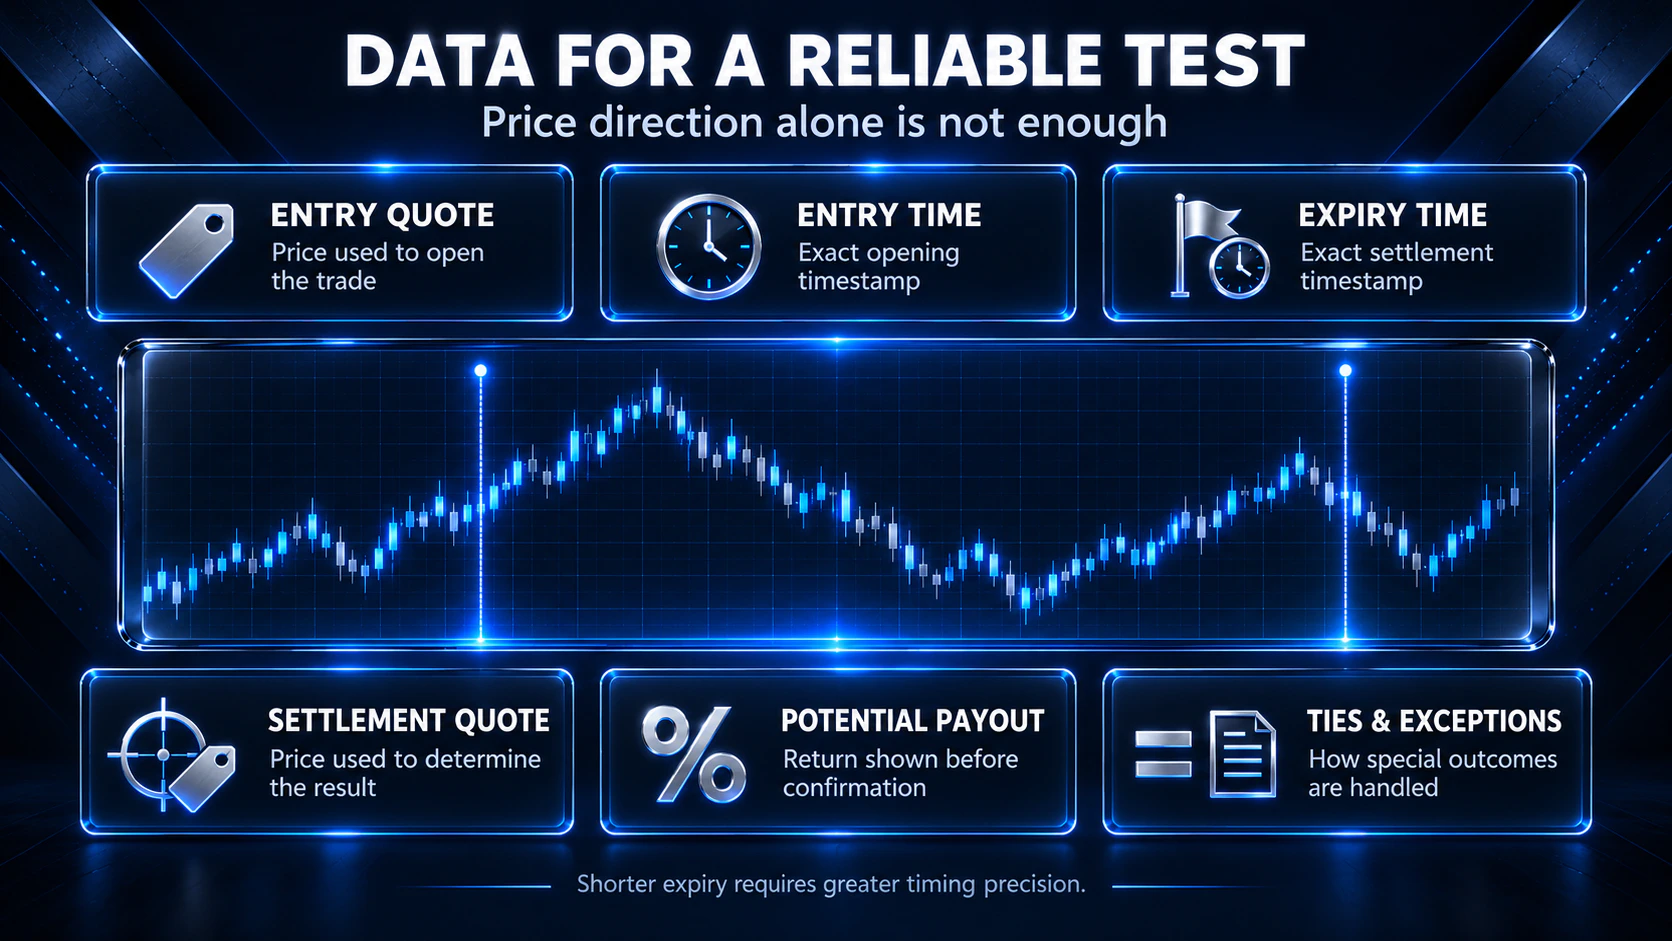
For a fixed-time trade, observing that the price “generally moved up” after a signal is not enough.
You need to establish:
- The assumed entry quote.
- The exact entry time.
- The expiry time.
- The quote used to determine the result.
- The potential payout.
- The treatment of equal quotes and other exceptional outcomes.
The shorter the expiry, the more important accurate timestamps and quotes become.
Why Candles Alone May Be Insufficient
Suppose a simulated trade opens at 12:00:07 and expires at 12:02:07. One-minute candles show the open, high, low, and close for each minute, but they do not necessarily reveal the quote at exactly seven seconds past the minute.
You cannot automatically assume that a candle’s closing price equals the trade’s expiry quote.
If the required data is unavailable, mark the result as undetermined. You may investigate an approximate model separately, but its results must not be presented as an exact reconstruction of trades.
The distinction between candle duration and trade expiry is explained in our guide to chart types and timeframes.
Do Not Mix Different Price Sources
An identical currency-pair name does not establish that two price histories are identical. Record the instrument’s exact label, including an OTC designation when one is present.
Do not substitute the history of one instrument for another simply because their charts look similar.
Use historical data that can reproduce the conditions your test requires. If that history is unavailable, start collecting observations and conduct a forward test on demo.
Do Not Apply Today’s Payout to Every Historical Trade
If historical payouts are unknown, you cannot claim that all past trades offered the same return as a trade available today.
You can instead run scenario calculations using several explicitly assumed payout rates. This shows how sensitive the idea is to payout conditions, but it remains a model rather than an actual performance record.
How to Backtest a Trading Strategy Step by Step
1. Select the Period Before Reviewing Results
Define the start and end of the test period in advance. Do not choose a section simply because it already shows an attractive directional move.
If the rule is intended for particular hours or market conditions, record those restrictions before testing.
Timestamps must be unambiguous. For example, label observations in Indian Standard Time as IST and observations in Coordinated Universal Time as UTC. Do not mix the two in one journal without converting them.
2. Separate Development from Evaluation
Divide the historical data chronologically:
- Use the first segment to develop and clarify the rule.
- Use a later, previously unused segment to evaluate the fixed version.
Do not randomly mix earlier and later observations. Future information is unavailable when decisions are made in real time.
If you change the rule after examining the evaluation segment, that segment has become part of development. A subsequent independent evaluation will require new data.
3. Review the History in Sequence
At each step, use only information that existed at the assumed decision time.
When reviewing manually, hide the future portion of the chart. Record your decision first, then reveal the next section.
If you already know the chart and remember the subsequent movement, you cannot treat the review as fully independent.
4. Include Every Qualifying Situation
Do not select only signals that produced favourable outcomes.
When the condition is met, the observation should enter the journal. If a trade is skipped, record the reason: an existing open trade, insufficient data, an unsuitable payout, or another restriction defined in advance.
An unknown result is a separate category. It must not automatically be counted as a win or quietly removed from the report.
5. Apply One Consistent Calculation Model
Use the same method for determining entry, expiry, payout, and costs throughout the test.
If the test assumes a fixed virtual amount, do not increase it after losses. Otherwise, you are changing both the trading rule and the way funds are allocated.
6. Save the Results Before Making Changes
At the end of the period, save the original journal and your conclusions.
If you develop a new idea, record it as a new version, such as “Version 1.1: confirmation condition changed.” Do not rewrite the previous version as though the new condition had existed from the beginning.
Why a High Win Rate Can Be Misleading
Win rate measures the frequency of successful outcomes. It does not account for how much you receive when a forecast is correct or how much you lose when it is incorrect.
Consider this hypothetical educational calculation, which does not represent actual Atlant Trade user performance:
- 100 completed trades.
- 57 winning trades and 43 losing trades.
- An identical amount of $10 per trade.
- The full trade amount is lost on an unsuccessful outcome.
- No ties, refunds, or additional costs.
| Net profit on a winning trade | Profit from 57 winning trades | Loss from 43 losing trades | Total result |
|---|---|---|---|
| 80% of the trade amount | $456 | −$430 | +$26 |
| 70% of the trade amount | $399 | −$430 | −$31 |
| 65% of the trade amount | $370.50 | −$430 | −$59.50 |
The win rate is 57% in all three scenarios, yet the financial results differ.
When the amount and payout conditions are constant, and an incorrect forecast loses the entire trade amount, the break-even win rate before additional costs is:
Break-even win rate = 1 / (1 + net profit rate).
At a net profit rate of 80%, use 0.8 in the formula. The break-even win rate is approximately 55.56%.
If payouts or trade amounts vary, calculate each trade separately. A simple formula using one payout percentage no longer describes the entire sequence.
For a detailed explanation of settlement and payouts, read how fixed-time trading works.
What to Record Besides Win Rate
Total and Average Result
The total result is the sum of all profits and losses, including the costs included in your model.
The average result is the total divided by the number of trades included. In the first scenario above, this is $26 / 100 = $0.26 per trade.
This is the average of a particular sample, not a promise of earning that amount in the future.
Maximum Drawdown
Drawdown measures a decline in the account balance from a previous peak to a subsequent low.
For example, if a simulated balance reaches $1,100 and then falls to $990, the drawdown is $110, or 10% of that peak.
Record deposits and demo-balance resets separately. They are not strategy performance and can distort comparisons.
Longest Losing Streak
Two strategies with the same final result can have very different sequences of wins and losses.
Record the highest number of consecutive losing trades. However, do not treat the historical maximum as a limit: a future losing streak may be longer.
Rule Adherence
Track how many decisions genuinely followed the original rule.
If some trades followed the written condition while others were opened because of urgency or a desire to recover losses, the combined result does not describe the strategy alone.
Keep the complete practice result, while reporting rule-compliant trades and rule violations separately.
How Many Trades Are Needed to Test a Strategy?
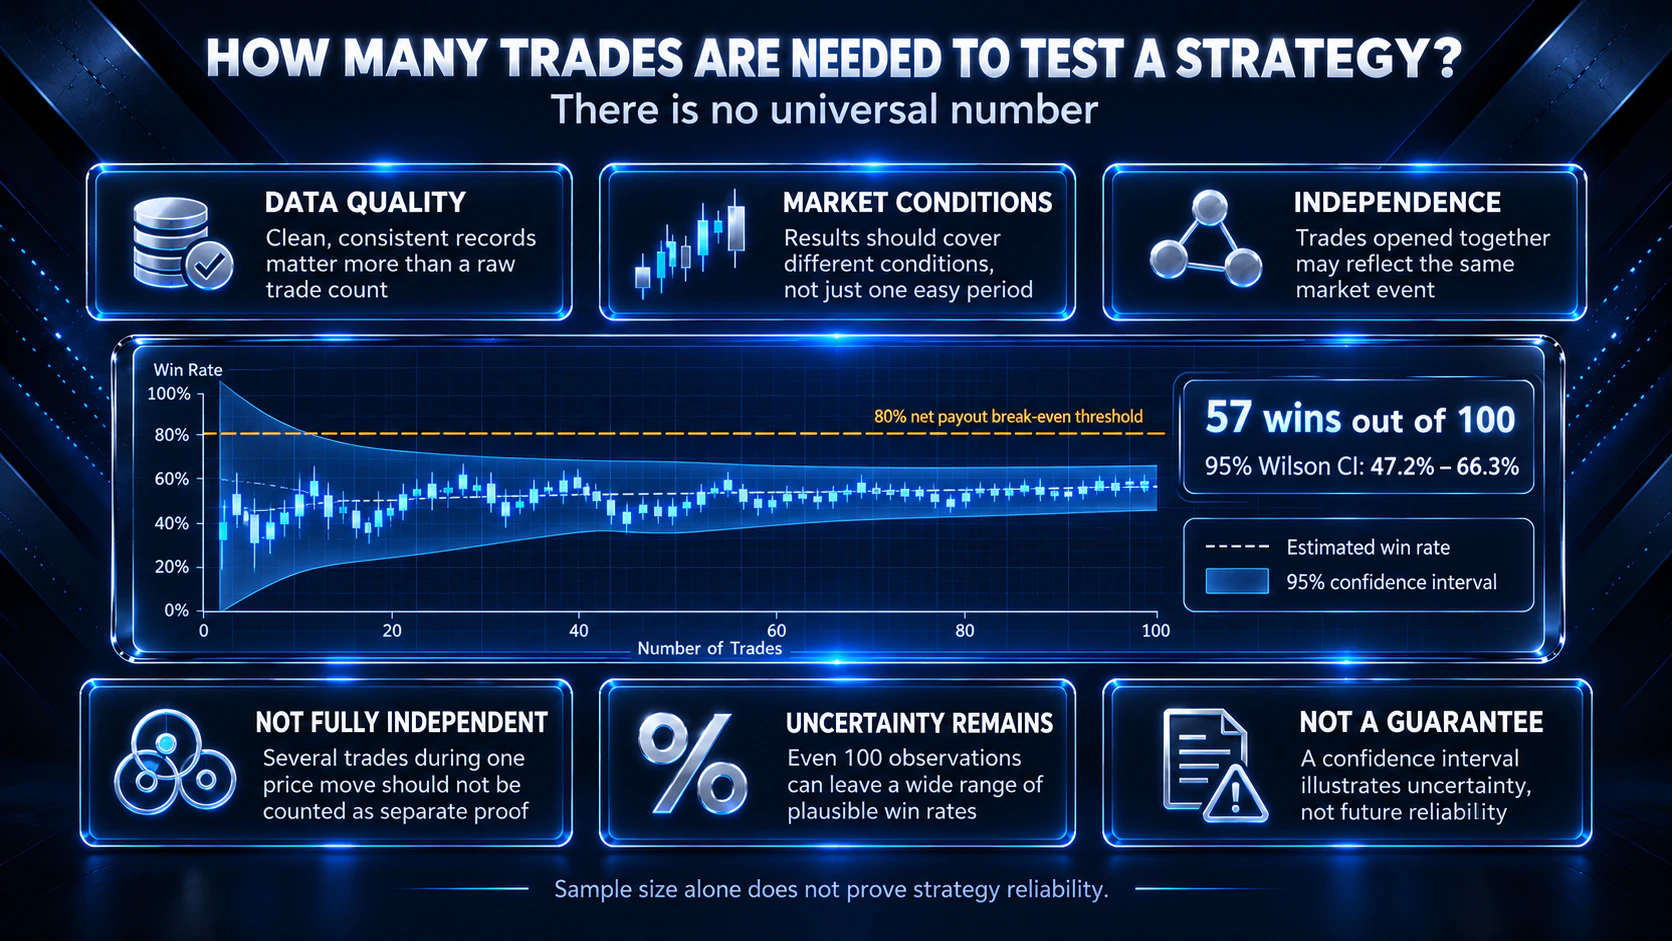
There is no universal number. Ten, one hundred, or five hundred observations do not automatically make a conclusion reliable.
Data quality, the number of strategy variations tested, the range of conditions, and dependence between outcomes all matter.
For example, several trades opened almost simultaneously during one price move may reflect the same market event. Treating them as fully independent observations would be overly optimistic.
Even 57 wins out of 100 leaves substantial uncertainty. Under a simplified model of independent outcomes with a constant probability of success, a 95% Wilson confidence interval for this example is approximately 47.2% to 66.3%. That range includes values both below and above the break-even threshold at an 80% net payout.
Actual trading conditions can change, and outcomes may be dependent. A calculation of this kind should therefore not be treated as a certificate of strategy reliability.
Mistakes That Make a Backtest Look Too Attractive
Look-Ahead Bias
This occurs when a decision uses information that was unavailable at the assumed entry time.
Examples include:
- Generating a signal from the final value of a candle that had not yet closed.
- Drawing a price level after a subsequent reversal becomes visible.
- Recording a trade at a price available before the entry condition was confirmed.
Overfitting the Parameters
Repeatedly changing an indicator period, expiry, and filters on the same history can produce a combination that fits the accidental features of that particular period.
The more variations you test, the greater the risk of selecting a result that performed well by chance. Keep a record of the attempts and rule changes, not just the best-performing version.
Selecting Only Convenient Examples
Reviewing five attractive entries does not replace a chronological test.
Your journal should also include unsuccessful signals, ambiguous situations, and periods without qualifying conditions.
Ignoring Delays
A signal may appear before a trade request is accepted.
For a short-expiry trade, a quote change between those moments can affect the outcome. In a historical model, record your delay assumption. During demo practice, record the actual timestamps available to you.
Changing the Amount After a Loss
Increasing the next trade amount to recover a loss changes the risk of the entire sequence.
For an initial comparison of rules, a constant virtual amount makes interpretation simpler. If you test a separate method for changing trade amounts, define it in advance and evaluate its potential losses as well as its returns.
How to Forward Test on the Atlant Trade Demo Account
Start forward testing with a fixed version of your rule. The objective is to observe how you apply it in new situations without knowing their outcomes.
- Select the demo account. Confirm that the virtual balance is active before beginning.
- Record the strategy version. Save its parameters and the date on which observations begin.
- Set a schedule. Choose periods when you can observe the chart consistently.
- Wait for the predefined condition. Do not create extra trades simply to increase the number of observations.
- Record the reason before the outcome. Save the parameters and, where possible, a screenshot of the setup.
- Record execution and settlement. Note the quotes, timestamps, payout, and result.
- Document deviations. A missed signal, late entry, or technical issue must not disappear from the journal.
- Review at a predetermined point. Do not end the test only because the balance temporarily reaches an attractive level.
You can stop practice when necessary, but preserve the reason for stopping and all results collected so far.
A separate spreadsheet maintained manually is sufficient for recording this process. Our guide to the Atlant Trade demo account explains the practice environment.
A Simple Strategy Testing Journal
| Field | What to record |
|---|---|
| Rule version | The strategy name and version number |
| Testing mode | Historical simulation or demo forward test |
| Asset and source | The exact instrument label |
| Date and time | A timestamp with its time zone |
| Chart timeframe | The duration represented by one candle |
| Entry condition | What happened before the trade was opened |
| Direction | Up or Down |
| Amount | The virtual or simulated trade amount |
| Entry and expiry | The timestamps and corresponding quotes |
| Payout and costs | Trade-specific values or clearly identified model assumptions |
| Outcome | Profit, loss, refund, or an undetermined result |
| Rule adherence | Full compliance or a documented deviation |
| Comment | A skipped signal, delay, missing data, or technical issue |
Do not merge historical calculations and demo trades into one performance figure without separating them. They are different types of observations with different limitations.
What If Forward Testing Performs Worse Than Backtesting?
Before changing indicators or increasing trade amounts, establish whether you are comparing equivalent conditions.
Check:
- Whether the instrument and price source match.
- Whether the timeframe and expiry are identical.
- Whether payouts are comparable.
- Whether the historical entry model was overly optimistic.
- Whether the rule was followed during demo practice.
- Whether price behaviour has changed.
- Whether there are enough observations for a meaningful comparison.
If you find a data or calculation error, correct it and recalculate the affected results.
If the rule itself changes, create a new version. Do not combine its results with the previous version as though they represent one unchanged approach.
If the reason for the difference remains unclear, “insufficient evidence” is a valid conclusion. Recognising uncertainty is more useful than making an unsupported claim.
When Is a Test Useful?
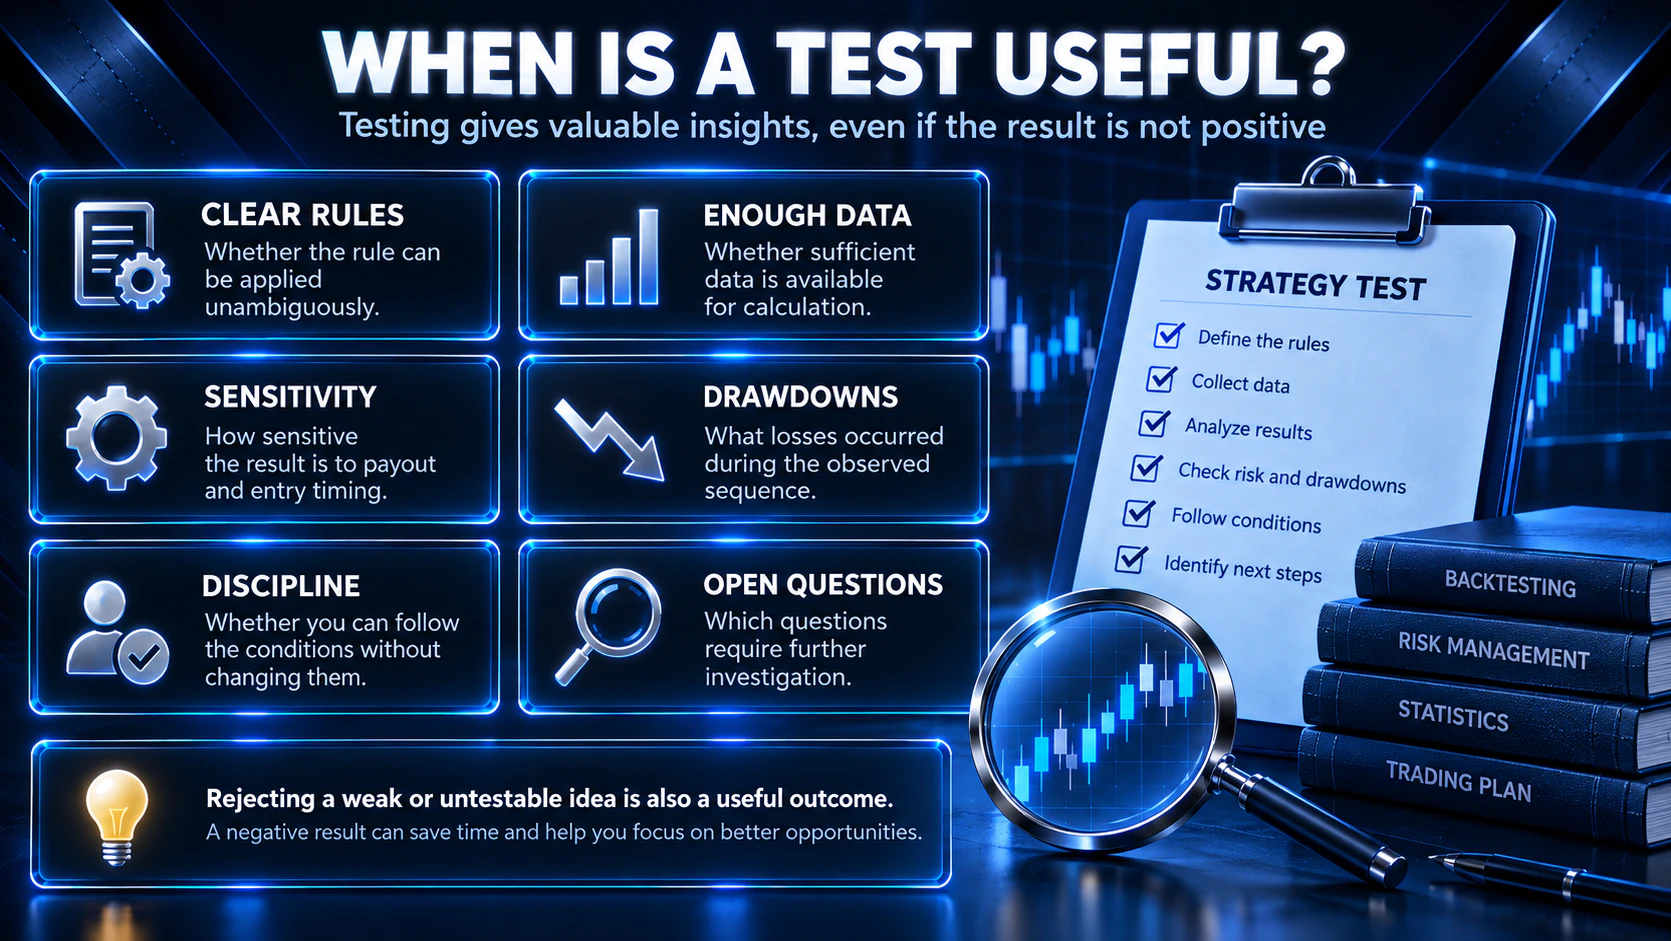
Testing can be valuable even when a strategy does not produce a positive result.
A well-conducted evaluation helps establish:
- Whether the rule can be applied unambiguously.
- Whether sufficient data is available for calculation.
- How sensitive the result is to payout and entry timing.
- What losses occurred during the observed sequence.
- Whether you can follow the conditions without changing them.
- Which questions require further investigation.
Rejecting a weak or untestable idea is also a useful outcome.
Frequently Asked Questions
Can I Test a Trading Strategy Without Programming?
Yes. You can begin with a chronological manual review and an observation table. However, working without code does not remove the need for accurate data. If the required quotes or payouts are unknown, a detailed journal alone cannot make the calculation reliable.
Do I Have to Backtest Before Forward Testing?
No. If suitable historical data is unavailable, you can start by defining the rule and conducting a forward test on demo. This takes time, but your decisions will be recorded before their outcomes become known.
Can I Change the Strategy During a Forward Test?
You can stop one version and begin another, but their results must remain separate. Changing conditions throughout the observation period and treating everything as one test makes it unclear which rule was evaluated.
How Should I Handle Missed Trades?
Record why the signal was missed. Keep the actual demo-practice result separate from any hypothetical calculation for the missed opportunity. Do not add missed winning trades to the statistics of executed trades.
Are Backtesting and Walk-Forward Testing the Same?
Walk-forward testing is a form of historical testing using successive time windows. Parameters are developed on one segment and evaluated on the next. It differs from a forward test in which new quotes actually arrive after observations have begun.
Does a Successful Demo Test Guarantee Live Profits?
No. Simulations and demo practice cannot reproduce every aspect of live trading, including financial and emotional pressure. Historical calculations may also model execution conditions inaccurately. A positive test does not guarantee that its result will be repeated.
Evaluate the Process, Not Just the Outcome
Start with one clearly defined rule. Fix its parameters, use suitable data, account for every outcome, and separate development from independent evaluation.
Continue observing on the Atlant Trade demo account without knowing future outcomes: record the reason for a decision before entry and the result after expiry.
A useful test reveals an idea’s limitations. That is what distinguishes a systematic evaluation from a collection of successful examples.
Risk notice: Backtesting and demo results are historical or simulated observations and do not guarantee future profits. A fixed-time trade can result in the loss of the entire amount allocated to it. Do not use borrowed money or funds needed for essential expenses.